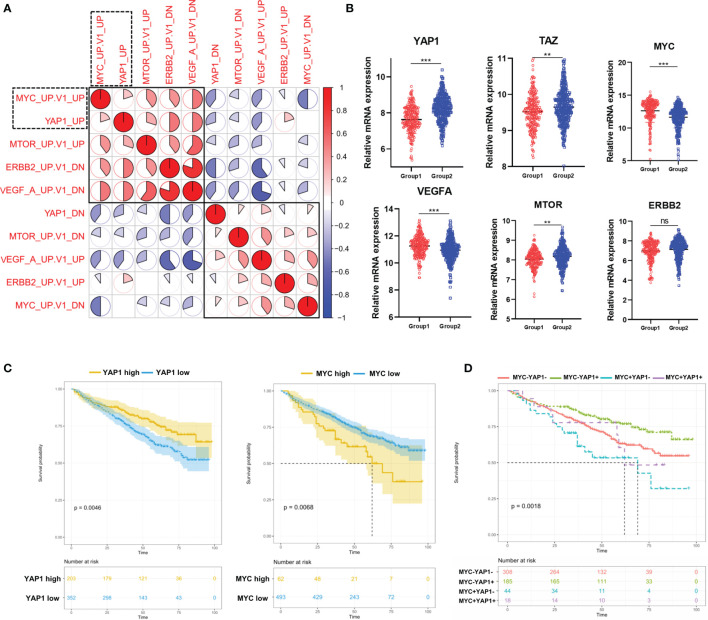
Figure 2.
The correlation among 5 pathways dysregulated in MM patients and their prognostic significances. (A) Heatmap of the correlation among 5 cancer-related signaling pathways using Pearson correlation coefficients. (B) The comparison of mRNA expression level of YAP1/MYC/MTOR/ERBB2/VEGFA/TAZ in 2 MM groups. Results are shown as mean ± SD. *p < 0.05, **p < 0.01, ***p < 0.001, based on the Student’s t-test. (C) Kaplan–Meier survival curves comparing the overall survival in MM cases with high or low expression of YAP1/MYC in the GSE24080 dataset. (D) Kaplan–Meier survival curves comparing the overall survival in MM cases with differential expression levels of YAP1 and MYC in the GSE24080 dataset. ns, not significant.

