Figure 3.
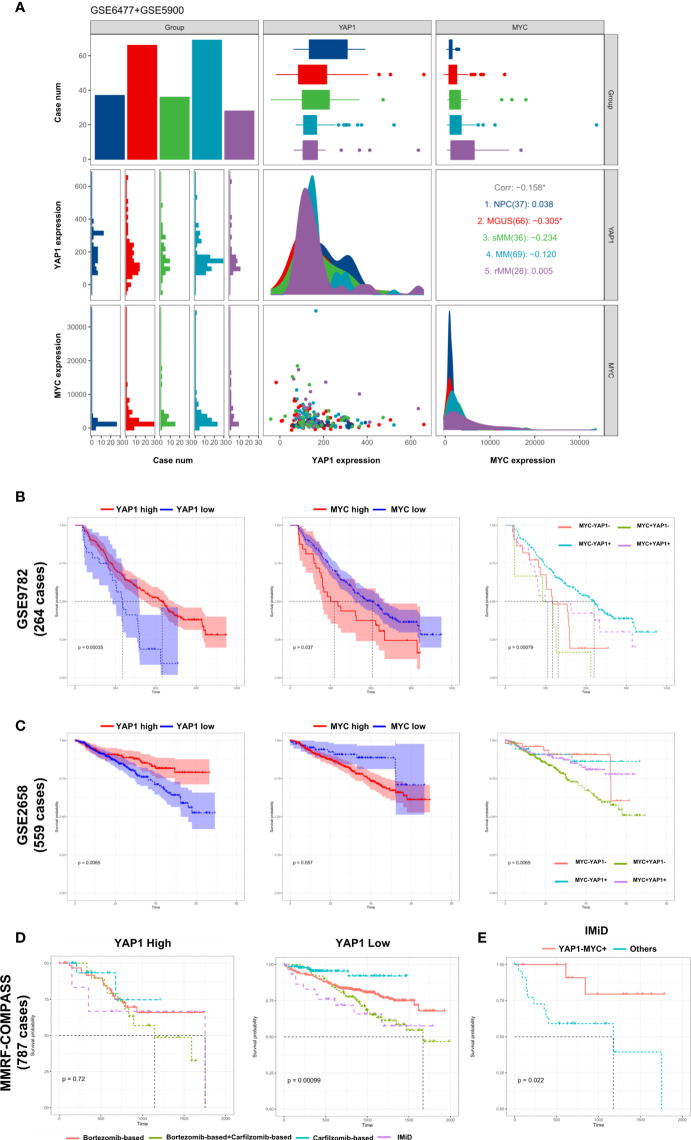
External validation of the prognostic significance of YAP1/MYC and their impact in MM therapies. (A) The comparison of YAP1/MYC mRNA expression levels in different developmental stages of MM. The x-axis represents case number/YAP1 count value/MYC count value from left to right while the y-axis represents case number/YAP1 count value/MYC count value from top to bottom. NPC: normal plasma cell; MGUS: monoclonal gammopathy of undetermined significance; sMM: smothering multiple myeloma; rMM: relapsed multiple myeloma. (B) Kaplan–Meier survival curves comparing the overall survival in MM cases with differential expression level of YAP1 and MYC in GSE9782 dataset (264 cases). (C) Kaplan–Meier survival curves comparing the overall survival in MM cases with differential expression level of YAP1 and MYC in the GSE2658 dataset (559 cases). (D) The survival rate of MM patients with high or low expression of YAP1 treated with different strategies. (E) The survival rate of YAP1-MYC+ MM patients versus others treated with IMiD.

