Figure 5.
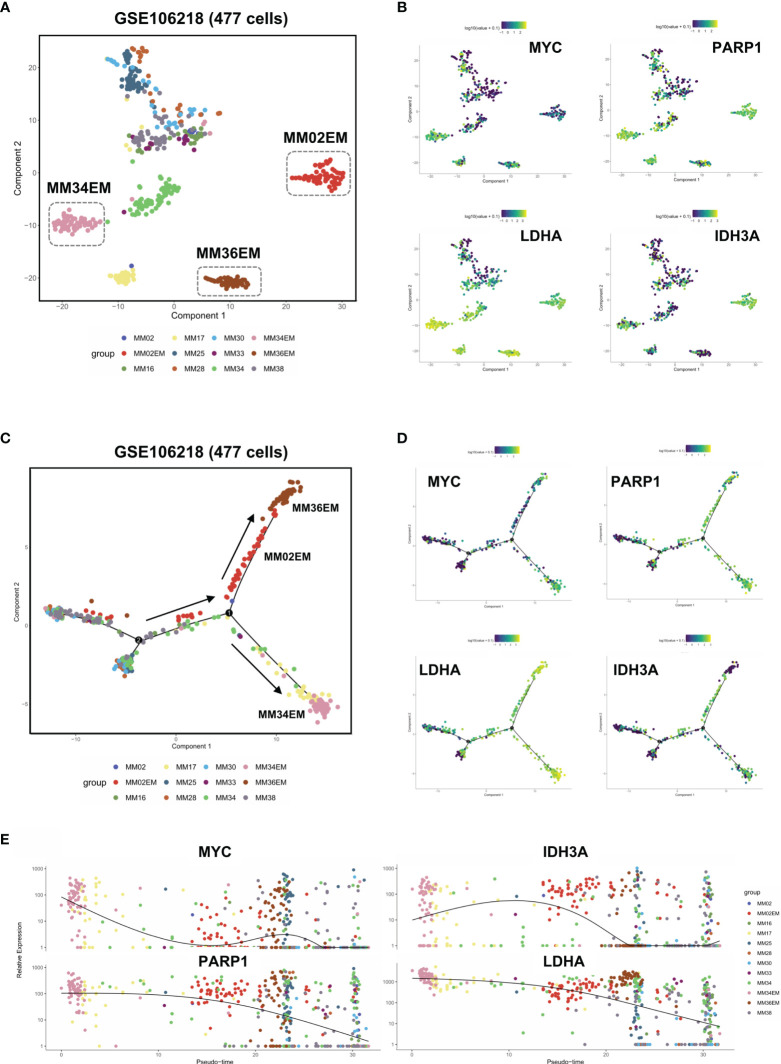
Dysregulated DNA repair process and metabolic reprogramming in Group 1 MM facilitated extramedullary invasion. (A) tSNE plots of 447 single-cell transcriptome data of primary and extramedullary MM samples based on the GSE106218 dataset. (B) The distribution and intensity of the expression of MYC/PARP1/LDHA/IDH3A on tSNE plots. (C) Pseudo time analysis of 447 single-cell transcriptome data via Monocle algorithm. Arrows indicated evolutionary directions. (D) The distribution and intensity of the expression of MYC/PARP1/LDHA/IDH3A on Monocle plots. (E) The expression intensity of MYC/PARP1/LDHA/IDH3A along pseudo time axis.

