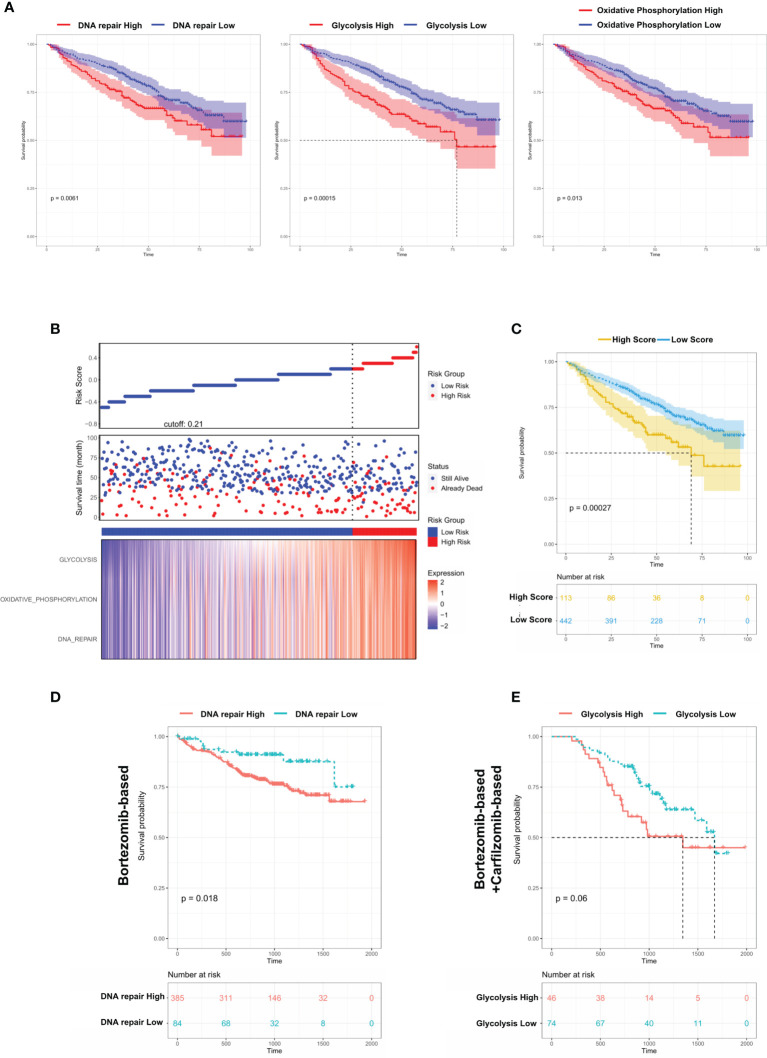
Figure 7.
Dysregulated biological processes in Group 1 MM cases shorten survival and affect therapeutic responses. (A) Kaplan–Meier survival curves comparing the overall survival in MM cases with high or low expression of DNA repair/glycolysis/oxidative phosphorylation scores in the GSE24080 dataset. (B) Distribution of risk score, OS, survival status (red dots indicate dead; green dots indicate alive), and the three pathway scores’ heatmap in GSE24080. (C) Kaplan–Meier survival curves comparing the overall survival in MM cases with high- or low-risk score in the GSE24080 dataset. (D) The survival rate of MM patients with high/low DNA repair score treated with Bortezomib-based therapy. (E) The survival rate of MM patients with high/low glycolysis score treated with Bortezomib-based+Carfilzomib-based therapy.

