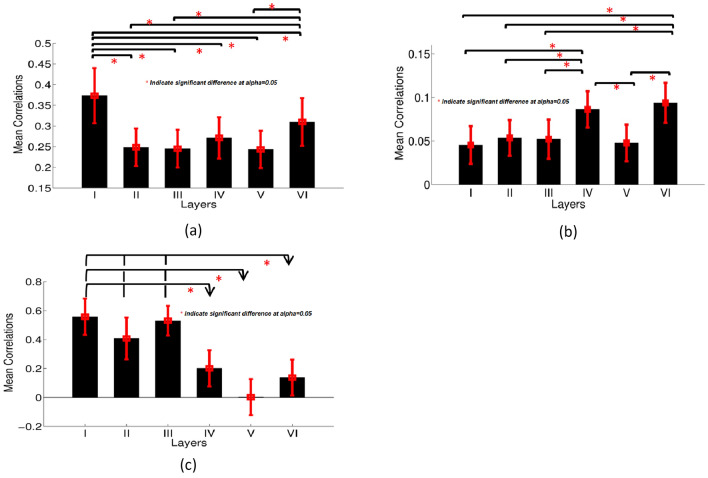
Fig. 8.
a Mean thalamo-cortical FC values between the entire thalamus and six cortical layers after blind deconvolution, i.e., using latent neural time series; b mean FC between the sensory core thalamus (VPL) and six different layers of primary somatosensory cortex after blind deconvolution; c mean inter-hemispheric cortico-cortical laminar FC values after blind deconvolution. *Significant difference with p (corrected) < 0.05. The error bar indicates the estimated standard deviation

