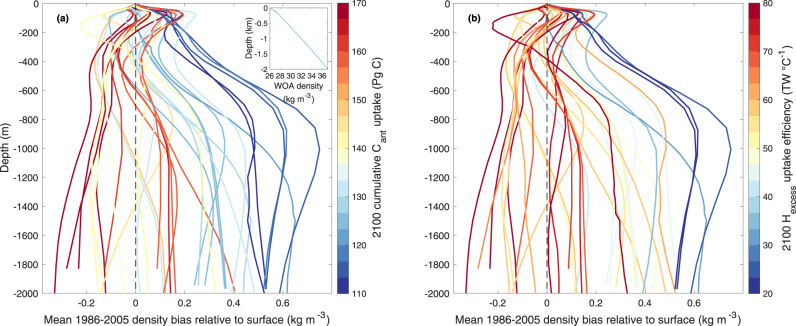
Fig. 2. Linkage between contemporary model density bias and projected future ocean carbon and heat uptake.
Vertical profiles of Southern Ocean (30°S–55°S) density bias (kg m−3) of CMIP5/6 models averaged over 1986–2005 relative to the density of the World Ocean Atlas 201354,55. The surface bias is subtracted from each profile, such that profiles start with a value of zero at the surface. Negative (positive) density bias relative to surface bias indicates weaker- (stronger-) than-observed stratification. Each line shows a single ESM and the colour indicates the magnitude of a cumulative Cant uptake and b Hexcess uptake efficiency for the year 2100. The World Ocean Atlas (WOA) density profile is provided as an inset of panel (a).

