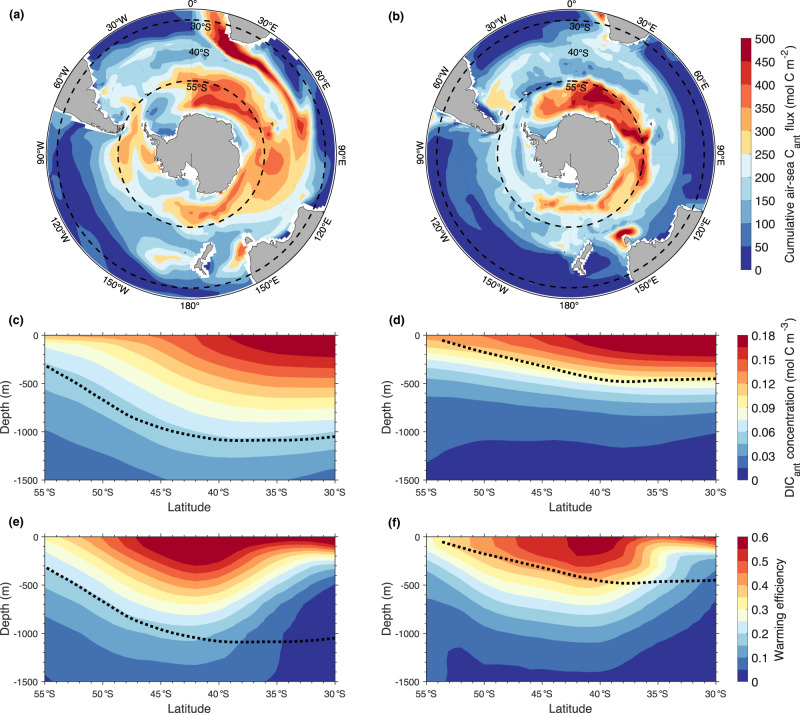
Fig. 3. Surface and interior distribution of carbon and heat for models with contrasting stratification states.
a, b Model-mean of the 1850–2100 cumulative Cant uptake for scenario RCP8.5 from a the three lowest-stratification-index CMIP5 models (CMCC-CESM, IPSL-CM5A-LR and IPSL-CM5A-MR) and b the three highest-stratification-index CMIP5 models (GFDL-ESM2G, HadGEM2-CC and HadGEM2-ES). Black dashed lines show the boundaries of our Southern-Ocean region (30°S–55°S). c–f Corresponding zonally-averaged transects from the c, e low- and d, f high-stratification models for dissolved inorganic Cant concentration and warming efficiency. The latter is defined as the ratio between the transient minus piControl temperature anomaly and the global surface atmospheric warming. The black dotted lines in panels c–f represent the zonally averaged density isolines crossing the depth of the salinity minimum at 30°S28. See Supplementary Fig. 2 for the corresponding CMIP6 models.

