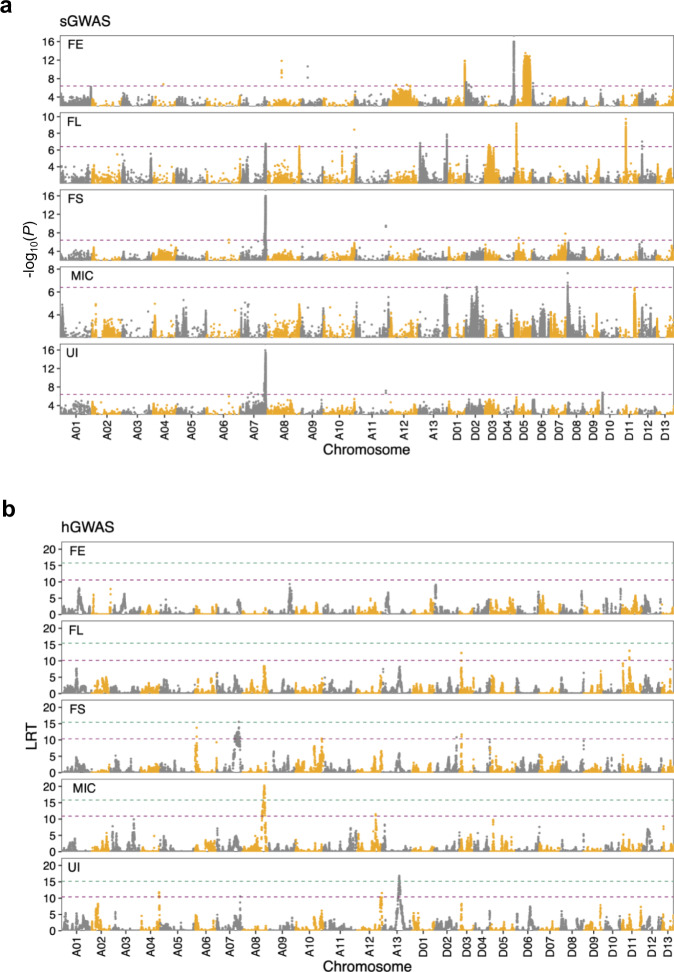
Fig. 3. Manhattan plots for five fiber-quality traits based on two different GWAS methods.
a SNP-based GWAS (sGWAS). Purple line represents the significant threshold (−log10P = 6.43). b IBD-based GWAS (hGWAS). Green line and purple line represent significant and suggestive thresholds. The 95th and 37th percentile of 100 permuted LRT scores were used as the significance threshold (LRT = 15.76, 15.14, 15.43, 15.83, 15.44) and suggestive threshold (LRT = 10.55, 10.39, 10.35, 10.92, 10.14), respectively. The fiber traits include elongation (FE), length (FL), strength (FS), micronaire value (MIC), and uniformity (UI).

