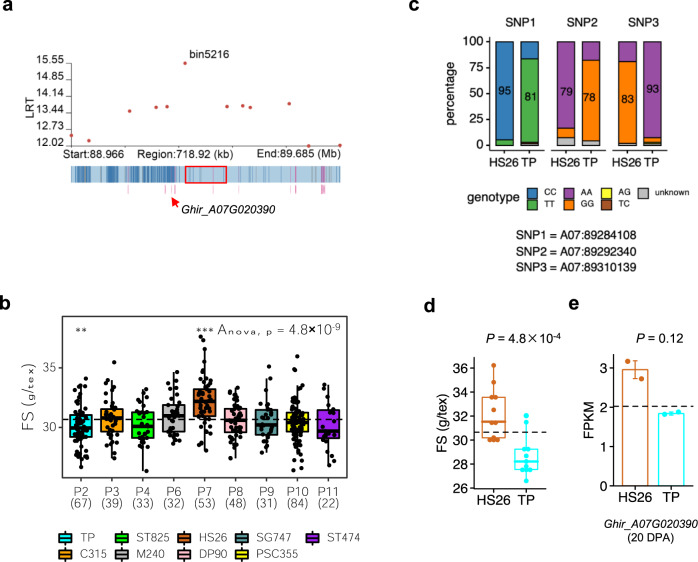
Fig. 4. Inference of functional allelic types across parent IBD groups for FS on chromosome A07 (88.97-89.69 Mb) and identification of the candidate genes.
a Dot plot of hGWAS result for FS (top) and SNP distribution (bottom) surrounding the peak on chromosome A07. Red box indicates the position of the most significant bin. Arrow indicates the position of candidate gene Ghir_A07G020390. b Boxplots for FS based on the different parent IBD groups (P) (n > 3). Parent IBD group was defined by the different status of bin5216. Dashed line indicates the mean value of FS in all RILs. ANOVA (P = 4.8 × 10⁻⁹) shows that the mean values of different parent IBD groups are not equal. Differences between RILs of a single parent IBD group and all RILs were analyzed by a two-tailed Student’s t-test (***P < 0.001; **P < 0.1). The numbers in parentheses are the MAGIC RIL counts in each parent IBD group. c Percentage of different genotypes of 3 SNPs located in bin5216 in HS26 and TP. d FS of parent HS26 and TP. P-value was calculated by Student’s t-test. Error bars, standard error. e Expression of gene Ghir_A07G020390 in parent HS26 and TP at the cell-wall-thickening stage (20 DPA) of fiber development. P-value was calculated by a two-tailed Student’s t-test. Error bars, standard error.

