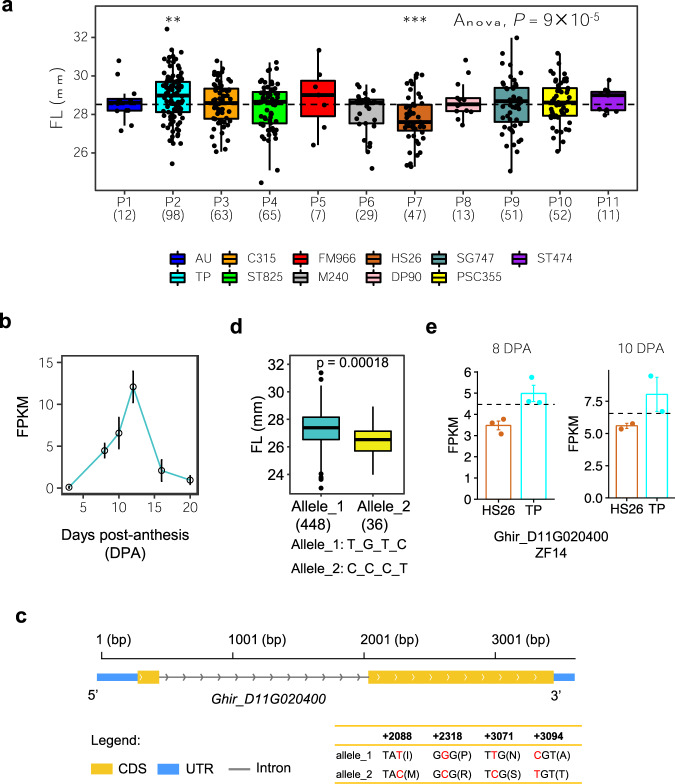
Fig. 5. Inference of functional allelic types across parent IBD groups for FL on chromosome D11 (24.25-24.72 Mb) and identification of candidate genes.
a Boxplots for FL based on the different parent IBD groups (P). Parent IBD group was defined by the different status of bin16702 and bin16703. Dashed line indicates the mean of FL in all RILs. ANOVA (P = 9 × 10⁻⁵) shows that the mean values of different parent IBD groups are not equal. Differences between RILs of a single parent IBD group and all RILs were analyzed by a two-tailed Student’s t-test (***P < 0.001; **P < 0.01). The numbers in parentheses are the MAGIC RIL counts in each parent IBD group. b Expression level of GhZF14 from 3 to 20 days post-anthesis (DPA) during fiber development. Error bars represent s.d. c Gene structure of GhZF14. Blue rectangles, yellow rectangles, and black lines indicate UTR, CDS, and intron, respectively. d Box plots for fiber length with the two functional alleles shown above (n = 448 vs. 36). Center line, median; box limits, upper and lower quartiles; whiskers, 1.5× the interquartile range. e Expression of gene Ghir_D11G020400 in parent HS26 and TP at 8 DPA and 10 DPA of fiber development.

