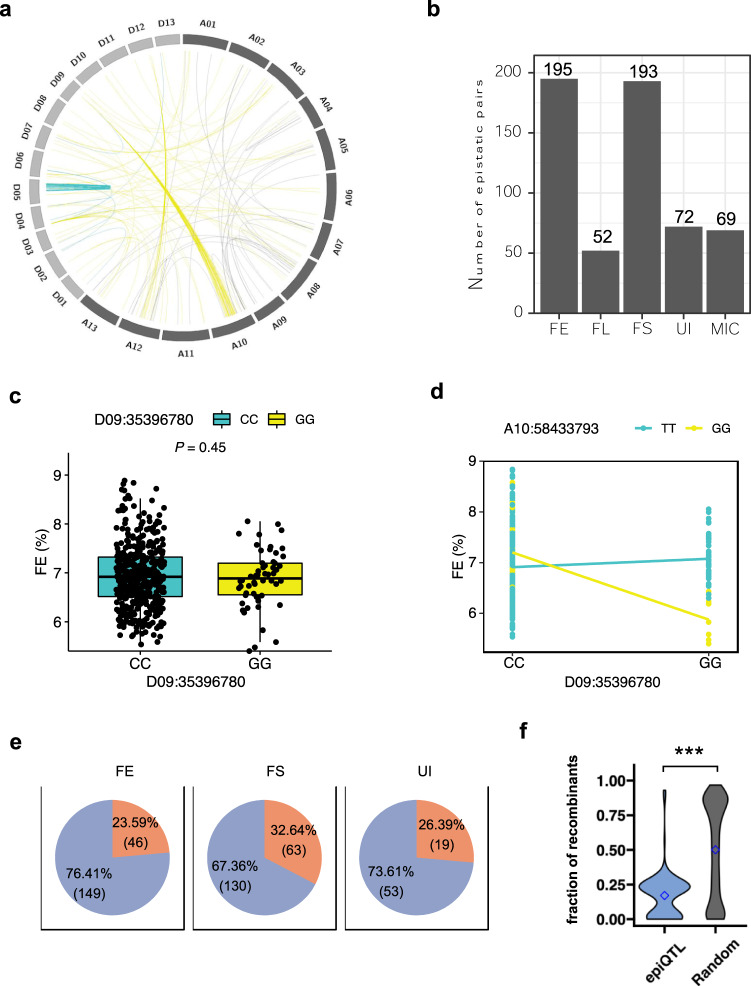
Fig. 6. Characterization of epistatic contribution to trait variance.
a Significant epistasis for FE. The epistatic analyses for other traits are shown in Supplementary Fig. 4. Gray line, AA epistasis; blue line, DD epistasis; yellow line, AD epistasis. b The number of significant epistasis for different traits. c Boxplot of FE in two genotypes at SNP D09:35396780 locus. t-test shows there is no difference between the two genotypes. d Interaction plot for epistasis between two SNPs (D09:35396780 × A10:58433793). This plot displays the relationship between D09:35396780 and A10:58433793 at two values of A10:58433793. e Different ratios for identified epiQTL linked with significant SNPs identified by sGWAS. Orange color, epiQTL linked with a significant SNP; blue color, neither of two interacting loci linked with any significant SNP. f Fraction of recombinants encompassing interacting pairs of loci between epiQTL and random distal pairs.

