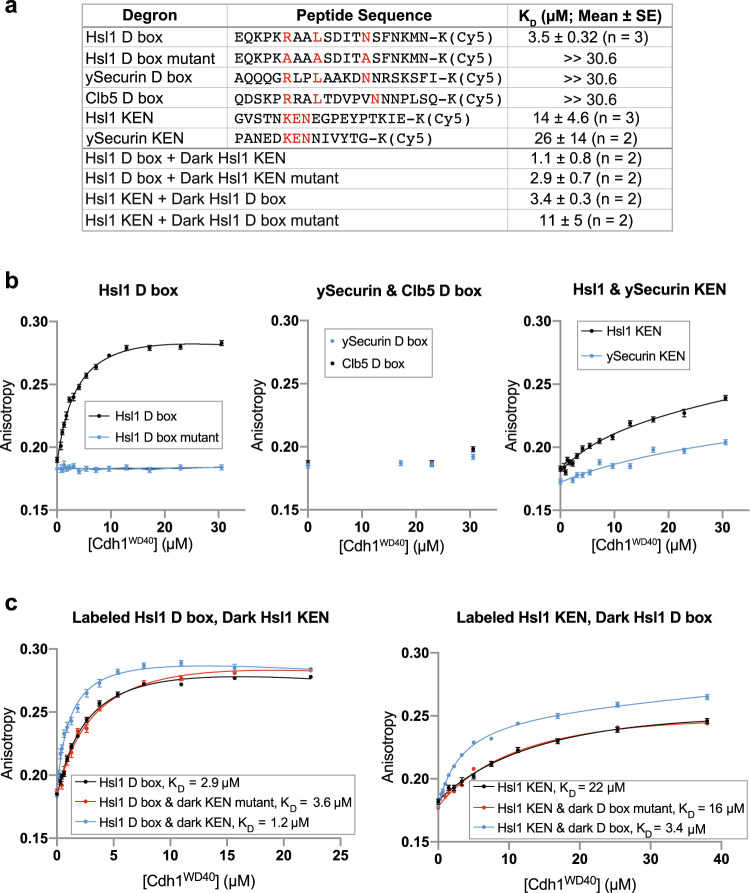
Fig. 1. Analysis of degron affinity by fluorescence anisotropy.
a List of Cy5-labeled degron peptides tested in anisotropy experiments with Cdh1WD40. Column at right lists mean KD values from multiple experimental replicates, including the representative experiments shown in b and c. b Fluorescence anisotropy experiments with the peptides listed in a. 10 nM peptide was incubated with up to 30.6 µM Cdh1WD40. Data points represent mean ± SE (n = 10 reads per reaction). In this experiment, KD values were as follows: Hsl1 D box, 4 µM; Hsl1 KEN, 12 µM; ySecurin KEN, 40 µM. Mean KD values from 2 or 3 independent experiments are shown in a. c Binding was measured with labeled degron peptide (10 nM) in the absence (black) or presence of an unlabeled version of the other degron (100 µM), either wild-type (blue) or mutated at key residues (red). Note that 100 µM KEN peptide is not completely saturating. Data points represent mean ± SE (n = 10 reads per reaction). Insets indicate KD values in this experiment. Mean KD values from two independent replicates are shown in a. Source data are provided as a Source Data file.

