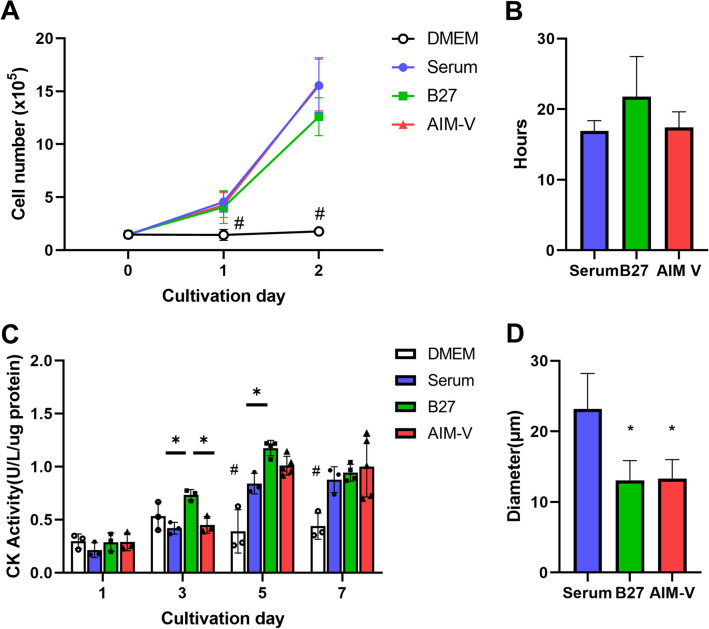
Figure 3.
Cell growth profiles during from day 0 to 2 of cultivation. (A) The growth rate for 2 days of cultivation. (n) = 3, #p < 0.05 versus Serum, B27, and AIM-V at each cultivation day. (B) Doubling time in each culture. (n) = 3 (C) Creatine kinase (CK) activity was measured for the assessment of myogenic differentiation during the entire cultivation period. (n) = 3–5. One-way ANOVA followed by Tukey’s test was performed for the multiple comparisons. *p < 0.05, #p < 0.05 versus Serum, B27, and AIM-V at each cultivation day. (D) Diameter of myotubes at day 7. In total, 20 randomly chosen myotubes were measured in each culture. *p < 0.05 versus Serum. Data presented as average ± standard deviation (SD).

