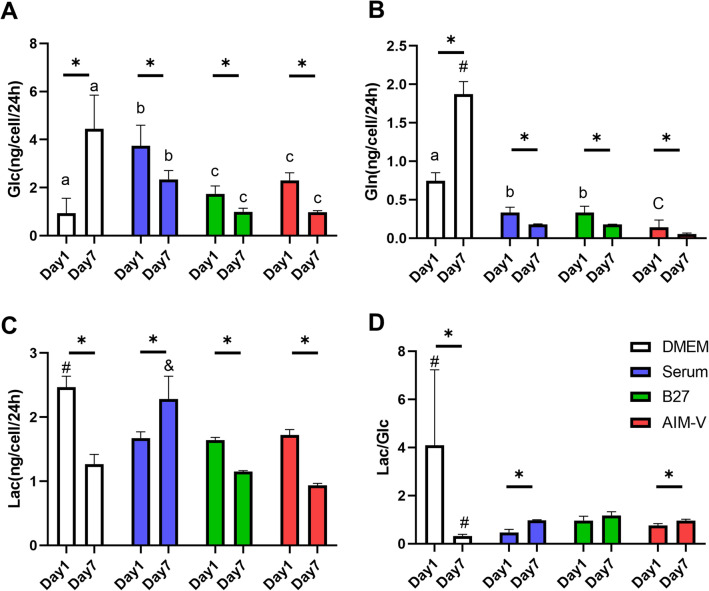
Figure 4.
The rates of consumption and secretion of extracellular metabolites at day 1 (myoblasts) and day 7 (myotubes) in DMEM, Serum, B27, and AIM-V cultures. The medium was collected from day 0 to 1 and 6 to 7, representing day 1 and 7, respectively. (A) The rate of glucose consumption. (B) The rate of glutamine consumption. (C) The rate of lactate secretion. (D) The ratio of lactate secretion to glucose production. (n) = 4. The student’s t-test was performed to compare day 1 and day 7 in each different culture. *p < 0.05. One-way ANOVA followed by Tukey’s test was performed for the multiple comparisons. #p < 0.05 versus Serum, B27, and AIM-V at each cultivation day. &p < 0.05 versus DMEM, B27, and AIM-V at each cultivation day. a–c, different letters in the same day indicate the significant statistical difference. Data presented as average ± standard deviation (SD).

