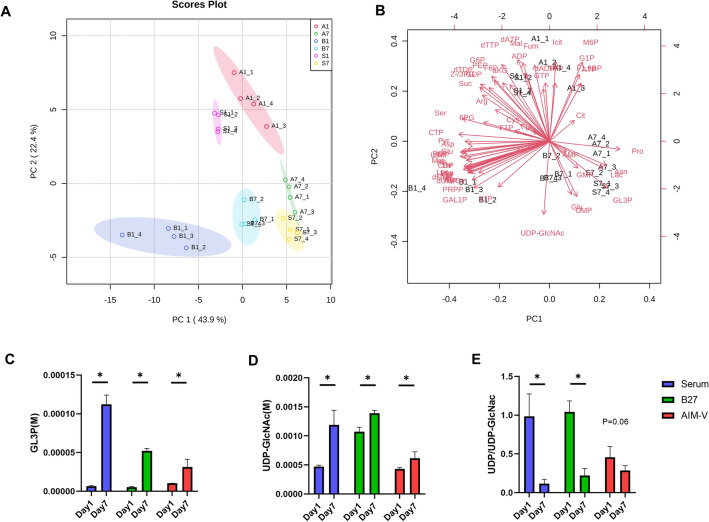
Figure 6.
Principle component analysis (PCA) of intracellular metabolites datasets of C2C12 myoblasts (day 1) and myotubes (day 7) cultured in Serum, B27, and AIM-V. (A) Score plot of PC2 versus PC1. The individual shaded area presents the 95% confidence interval of the group. (B) Biplot. In total, 66% of the data variation is explained by PC1 and PC2. A1, B1, and S1 indicate AIM-V, B27, and Serum culture at day 1, and A7, B7, and S7 indicate AIM-V, B27, and Serum culture at day 7. Significantly increased metabolites in myotubes (day 7) versus myoblasts (day 1) cultured in Serum, B27, and AIM-V mediums. (C) Absolute intracellular concentration (M) of GL3P. (D) Absolute intracellular concentration (M) of UDP-GlcNAc in Serum, B27, and AIM-V culture. (E) The ratio of UDP/UDP-GlcNAc, indicating O-GlcNAcylation. (n) = 4. The student’s t-test was performed to compare day 1 and day 7 in each different culture. *p < 0.05. Data presented as average ± standard deviation (SD).

