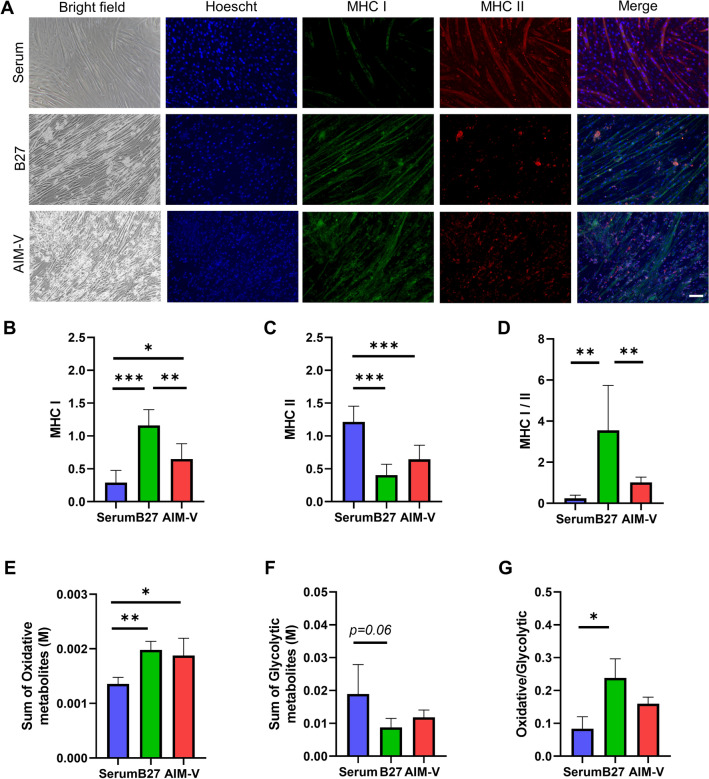
Figure 8.
(A) Representative images of phase-contrast and immunostaining of MHC I and II in C2C12 cells at day 7 in Serum, B27, and AIM-V cultures. Images show immunostaining for MHC I (green), MHC II (red) and Hoechst counterstained nuclei (blue). Merged panels show composite images. Scale bar indicates 100 µm. Quantification of MHC I and II images from A was shown following figures. The positively MHC I and II—stained area was normalized to nuclei area. (B) Quantification results of MHC I (slow type)—positive stained myotubes. (C) Quantification of MHC II (fast type)-positive stained myotubes. (D) The ratio of quantified MHC I to MHC II, indicating slow type of muscle is more dominant. The experiments were performed three times and representative results are shown. (E) The sum of the glycolytic metabolism-related metabolites (G6P, F6P, F1, 6BP, 2/3-PG, PEP, Pyr, and Lac) and (F) Oxidative metabolism-related metabolites (Cit, Icit, aKG, Suc, Fum, IA, and Mal). (G) The ratio of sum of oxidative to glycolytic-related metabolites. Data presented as average ± standard deviation (SD). (n) = 4. *p < 0.05, **p < 0.01, ***p < 0.001.

