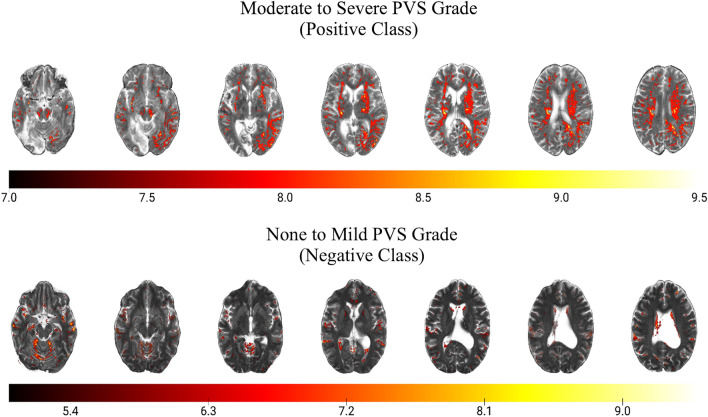
Figure 2.
3D gradient class activation maps (3DGradCAM) showing prototypical activations for examples in each classification (positive versus negative). Positive examples showed high activation in several relevant midline regions, including midbrain, basal ganglia, and centrum semiovale (top panel). Negative examples had fewer activations in the high activation range (> 7) and smaller activations localized in non-relevant (random) areas (bottom panel).

