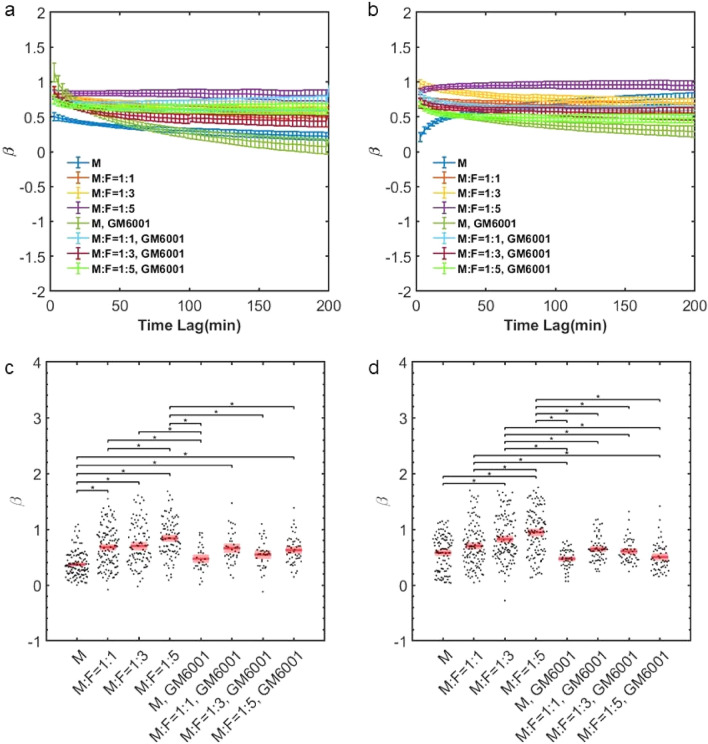
Figure 5.
MDA-MB-231s migrate with altered diffusivity in the presence of NHLFs. (a) Average beta on day0, error bar in SEM. (b) Average β on day1, error bar in SEM. (c) β taken at the 90 min time interval, day 0. (d) β taken at the 90 min time interval, day 1. M indicates MDA-MB-231, and F indicates NHLF. The ratio indicates the initial seeding concentration ratio of MDA-MB-231 to NHLF cells. Red line indicates the mean value and pink boxes indicate the 95% confidence interval. One way ANOVA was performed to show the difference across all conditions. * indicates the two compared conditions are significantly different (p < 0.05). Histogram data are shown in supplementary information SI Fig. 4. In each condition, around 50–120 cells were tracked. Data were collected from at least 3 independent experiments with 2 replicates sampled in each experiment.

