Figure 3.

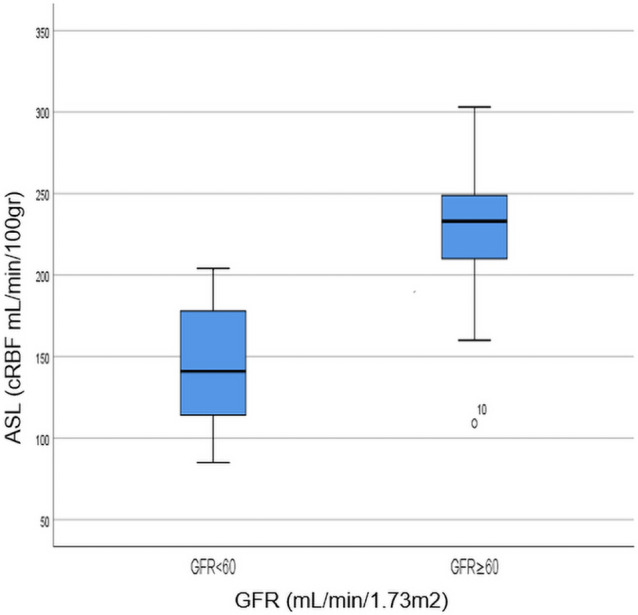
Box plot showing a comparison of perfusion values in patients with GFR < 60 and GFR ≥ 60 mL/min/1.73 m2; an outlier from group 2 (GFR ≥ 60 mL/min/1.73 m2) falling out of the boxplot corresponds to the participant number 10 in Table 1.

Box plot showing a comparison of perfusion values in patients with GFR < 60 and GFR ≥ 60 mL/min/1.73 m2; an outlier from group 2 (GFR ≥ 60 mL/min/1.73 m2) falling out of the boxplot corresponds to the participant number 10 in Table 1.