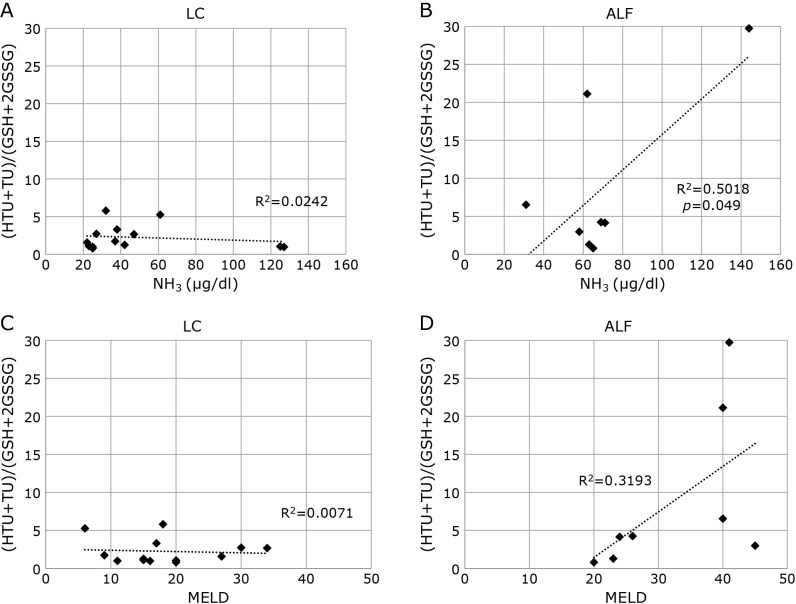
Fig. 5.
Correlation between the ratio of HTU + TU to GSH + 2GSSG and NH3 in A) LC and B) ALF groups, and between the ratio of HTU + TU to GSH + 2GSSG and MELD score in C) LC and D) ALF groups. The ratio of HTU + TU to GSH + 2GSSG and NH3 levels showed a high positive correlation in ALF but no correlation in LC. LC, liver cirrhosis; ALF, acute liver failure; HTU, hypotaurine; TU, taurine; GSH, reduced glutathione; GSSG, oxidized glutathione; MELD, model for end-stage liver disease.

