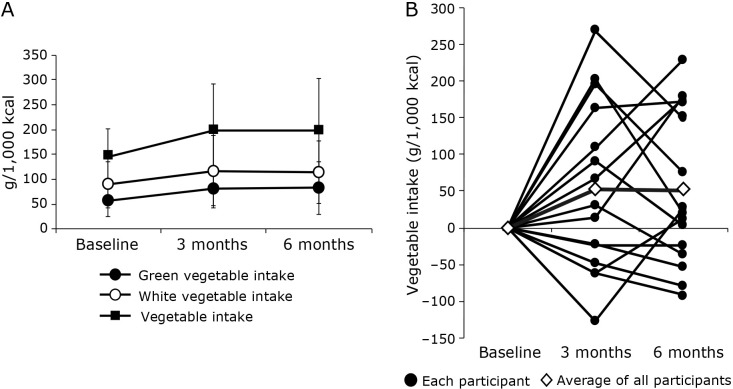
Fig. 2.
The trends in the patients’ vegetable intake during the intervention period. (A) Green, white, and total vegetable intakes at baseline and 3 and 6 months for all participants. Values are presented as mean ± SD. Differences in intake between baseline and 3 or 6 months were assessed using the paired t test for normally distributed data and the Wilcoxon signed-rank test for non-normally distributed data. (B) Total vegetable intake at baseline and 3 and 6 months for each participant and the average intake for all participants.

