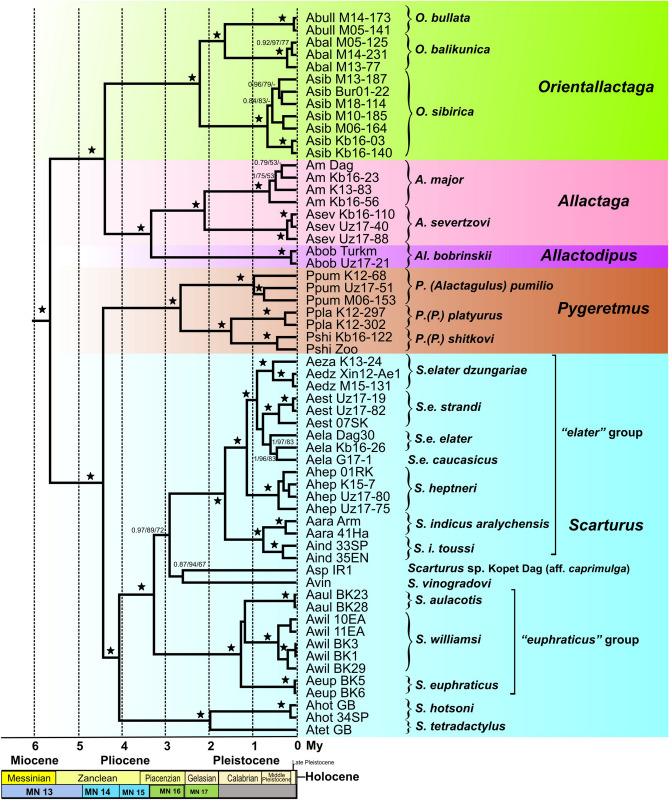
Figure 2.
Chronogram of the divergence events in the Allactaginae produced by the BEAST algorithm based on the analysis of nuclear genes. Values above the branches correspond to posterior probabilities in Bayesian analysis (≥ 0.75) and bootstrap support (1000 pseudoreplicates, ≥ 50%) in the ML and MP analyses, respectively (BPP/ML/MP). Asterisks mark the nodes with absolute support in all analyses. Relationships among outgroup lineages are shown in Fig. S3.

