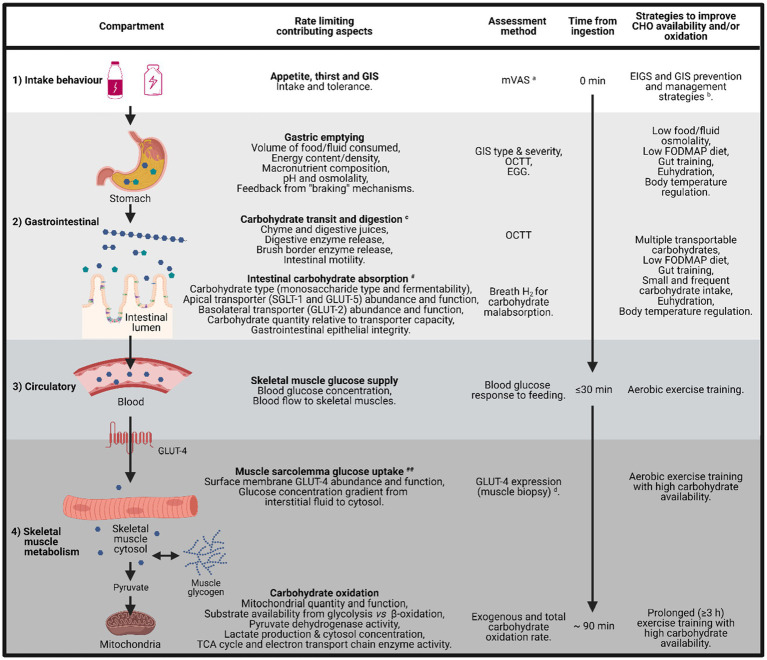
Figure 5.
Schematic illustration of the barriers and limitations to total carbohydrate availability and oxidation, from mouth to mitochondria, including the time course for carbohydrate uptake and oxidation, factors that limit each step, assessment method for quantification, and potential strategies to reduce these limitations. aModified visual analogue scale (mVAS; Gaskell et al., 2019). bEIGS and GIS prevention and management strategies (Costa et al., 2017b, 2020b). cGastrointestinal brake mechanisms: nutritive and non-nutritive residue along the small intestine, and inclusive of terminal ileum, results in neural and enteroendocrine negative feedback to gastric activity (Layer et al., 1990; Van Citters and Lin, 2006; Shin et al., 2013; van Avesaat et al., 2015; Miall et al., 2018). dGLUT-4 detection methods (McGee and Hargreaves, 2006; Flores-Opazo et al., 2020). #dependent on taste receptors (e.g., T1R3 and α-gustducin expressed in epithelial enteroendocrine cells) and gut hormones (e.g., GIP and GLP-1 that are activated by taste receptor stimulation – nutrient presence along the intestinal lumen) that regulate the SGLT-1 protein synthesis and translocation to the apical border of enterocytes (Rozengurt, 2006; Margolskee et al., 2007; Shirazi-Beechey et al., 2011). ##Dependent on magnitude of skeletal muscle blood perfusion, sarcolemma GLUT-4 concentration, GLUT-4 saturation, cytosol Ca2+ flux, glycolytic enzyme concentration and activity (i.e., intramuscular glucose metabolism gradient; Hargreaves and Spriet, 2020). EGG, electrogastrography and OCTT, orocecal transit time.

