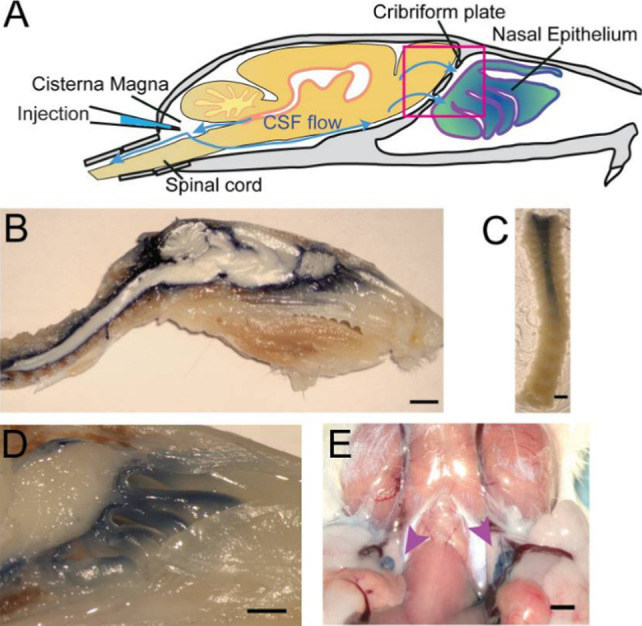
Figure 1.

Structural depiction of CSF flow through the cribriform plate of a mouse model from Norwood Et. Al. (PMID: 31063132). (A) Schematic diagram of anticipated egress from neural tissue into nasal epithelium. (B) Sagittal midline section following injection of EB into cisterna magna. (C) Decalcified spinal column after EB injection into cisterna magna. (D) Visualization of the area enclosed by pink box in (A) depicting contrast movement across the cribriform plate. (E) EB dye localization into deep cervical lymph nodes marked by purple arrows following injection at cisterna magna.
