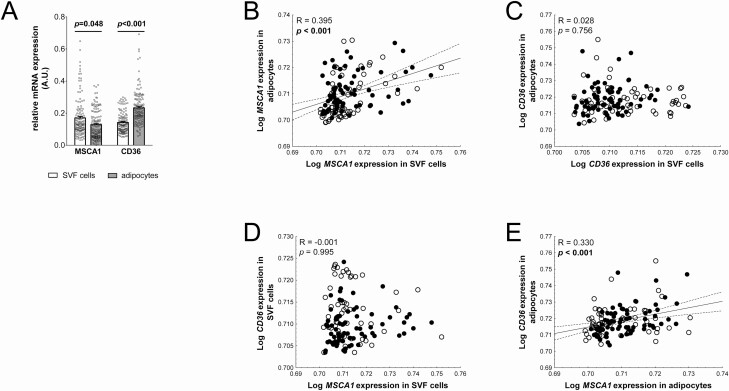
Figure 1.
CD36 (cluster of differentiation 36) and MSCA1 (mesenchymal stem cell antigen 1) are differentially expressed in SVF cells and adipocytes. (A) MSCA1 expression is significantly lower and CD36 expression is significantly higher in adipocytes compared to cells of the stroma vascular fraction (SVF; mean ± standard error of the mean; individual values represented as circles; n = 133). (B) MSCA1 expression in SVF cells is positively associated with adipocyte MSCA1 expression. (C) CD36 expression in SVF cells does not show a correlation with the amount of CD36 messenger RNA in adipocytes. (D) There is no association between MSCA1 and CD36 expression in SVF cells. (E) MSCA1 correlates with CD36 gene expression in adipocytes. Pearson correlation coefficient R and P-value are given in each scatter plot. Significant P-values (P < 0.05) are indicated in bold. Lean children are represented as open circles and children with overweight/obesity, as closed circles.

