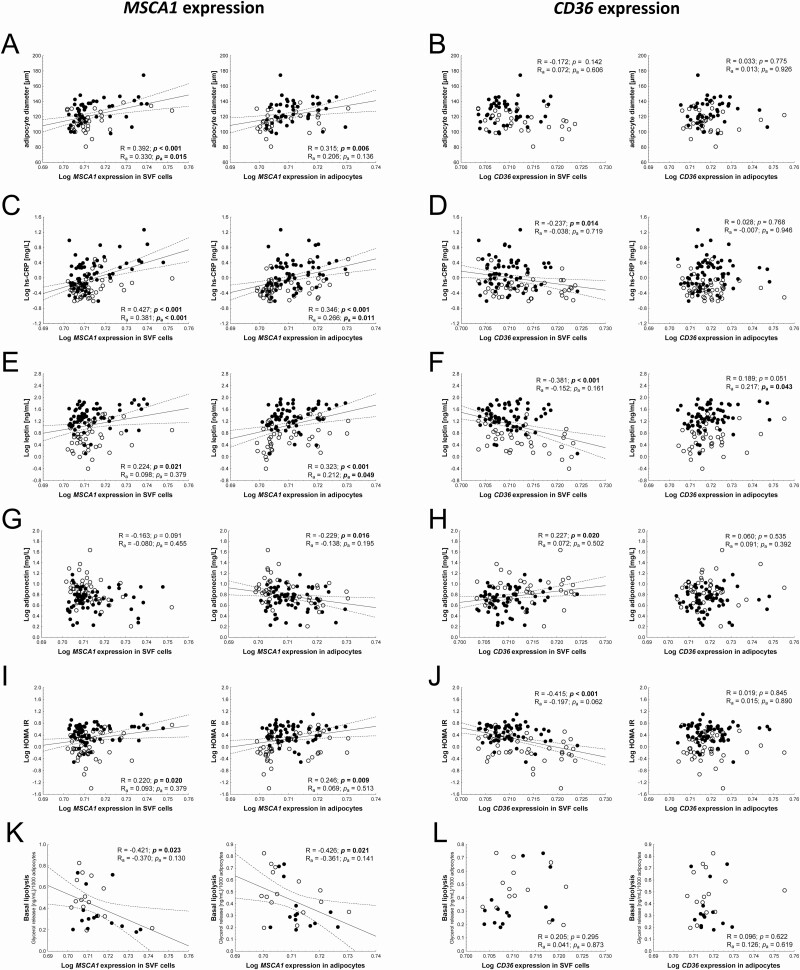
Figure 2.
MSCA1 (mesenchymal stem cell antigen 1) expression correlates with adipocyte size and parameters of adipose tissue (dys)function. (A) High MSCA1 expression in stroma vascular fraction (SVF) cells and adipocytes is associated with larger adipocytes in adipose tissue, while (B) CD36 (cluster of differentiation 36) expression is not correlated to adipocyte size. (C) The low-grade system inflammation marker high-sensitivity C-reactive protein (hs-CRP) is increased with increasing MSCA1 expression levels. (D) CD36 expression in SVF cells shows a negative association with hs-CRP. (E) MSCA1 expression in both SVF cells and adipocytes is positively associated with leptin serum levels whereas (F) CD36 expression in SVF cells shows a negative correlation. (G) MSCA1 expression in adipocytes shows a negative correlation with adiponectin serum levels whereas there is no correlation for expression in SVF cells. (H) In contrast, a positive association exists between CD36 expression in SVF cells and adiponectin serum levels but not with CD36 expression in adipocytes. (I) Similar to leptin, the homeostasis model assessment-insulin resistance shows a positive correlation with MSCA1 expression and (J) a negative association with CD36 expression in SVF cells. (K) MSCA1 expression is negatively associated with basal lipolytic activity of adipocytes (L) but shows no correlation with CD36 expression. Pearson correlation coefficient are given unadjusted (R and P-value) and adjusted (Ra and Pa-value) in each scatter plot. Significant P-values (P < 0.05) are indicated in bold. Lean children are represented as open circles and children with overweight/obesity, as closed circles.

