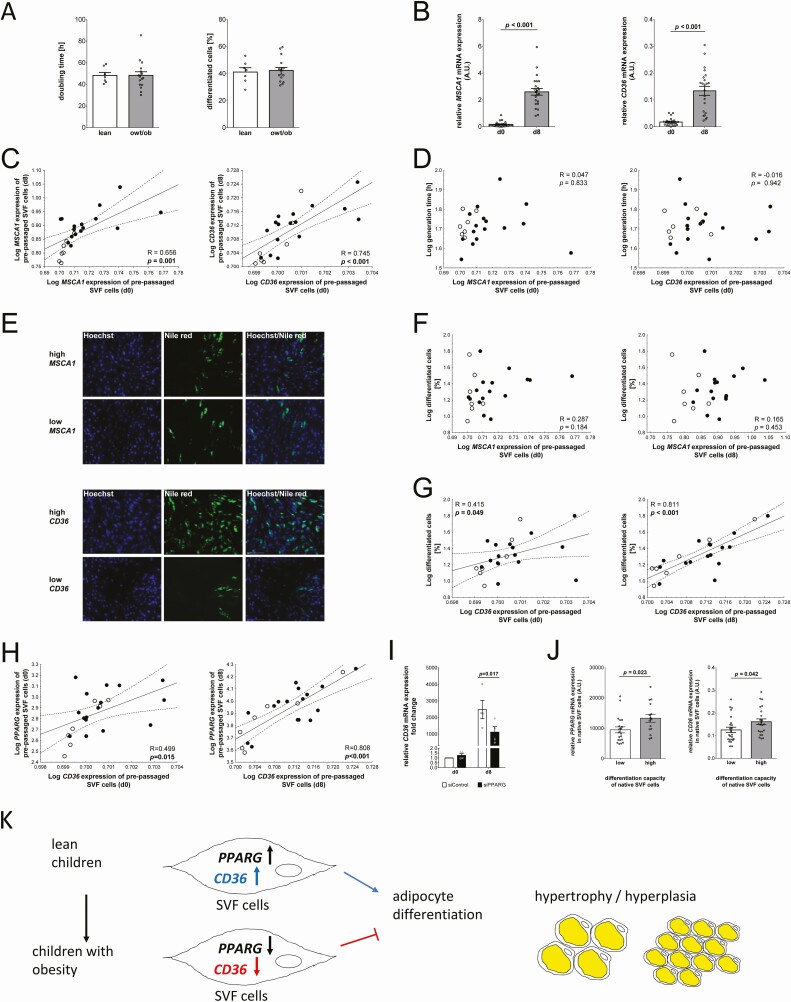
Figure 3.
CD36 (cluster of differentiation 36) gene expression is related to differentiation capacity of stroma vascular fraction (SVF) cells in vitro. (A) Body weight groups are not indicative for in vitro proliferation or differentiation capacity of prepassaged SVF cells. Quantitative data of n = 23 children samples are presented as mean ± standard error of the mean (SEM). (B) MSCA1 (mesenchymal stem cell antigen 1) and CD36 messenger RNA (mRNA) levels of prepassaged SVF cells increase during adipocyte differentiation (bar plots show quantitative data of n = 23 SVF samples; mean ± SEM). (C) SVF mRNA level of MSCA1 and CD36 before differentiation correlate with gene expression after differentiation. (D) There is no association between MSCA1/CD36 expression in prepassaged SVF cells and generation time of proliferating cells. (E) Cells were grouped for high and low MSCA1 or CD36 expression at baseline (d0) and adipocyte differentiation was analyzed. Representative images of differentiated SVF cells (d8) after Hoechst and Nile Red staining (scale bar 200 µm). MSCA1 gene expression is not related to (F) the percentage of differentiated cells while (G) high CD36 expression is associated with higher percentages of differentiated cells. (H) In accordance with this, there is a positive correlation between PPARG expression and CD36 expression, before and after differentiation into mature adipocytes. (I) Small interfering RNA knockdown of PPARG in Simpson Golabi Behmel Syndrome cells results in decreased CD36 expression. (J) High differentiation capacity of native SVF cells (grouped according to the median of the samples) is associated with higher PPARG and CD36 mRNA expression in native SVF cells (bar plots show quantitative data of n = 47 SVF samples; mean ± SEM). (K) Schematic overview of the proposed role of CD36 mRNA in adipose tissue of children. Pearson correlation coefficient R and P-value are given in each scatter plot. Significant P-values (P < 0.05) are indicated in bold. Lean children are represented as open circles and children with overweight/obesity (owt/ob), as closed circles. Abbreviation: PPARG, peroxisome proliferator-activated receptor gamma.

