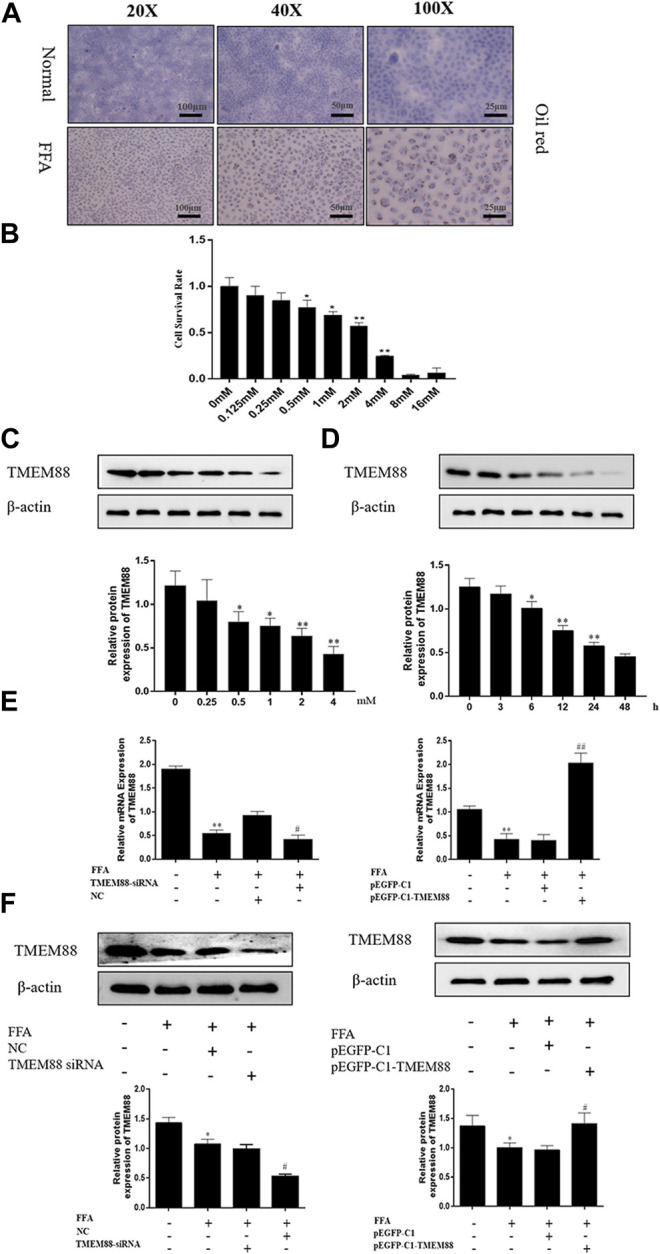
FIGURE 3.

FFA inhibited TMEM88 expression in AML-12 cells. (A) The oil red stains in AML-12 cells and FFA-induced AML-12 cells. The results showed that fat granules appear in the FFA-induced cell model. (B) Viability of AML-12 cells at different FFA concentrations. (C) TMEM88 protein expression level was significantly reduced, after being induced with 2 mM FFA. (D) A significant reduction of the expression level of TMEM88 protein was significantly reduced after FFA was stimulated with 24 h. (E) TMEM88 mRNA expression levels in FFA-induced AML-12 cells after pEGFP-C1-TMEM88 and TMEM88 siRNA transfection. (F) TMEM88 protein expression levels in FFA-induced AML-12 cells after transfected with pEGFP-C1-TMEM88 and TMEM88 siRNA. (The data are represented by at least three independent mean ± SD, *p < 0.05, **p < 0.01 vs normal group. # p < 0.05, ## p < 0.01 vs control group).
