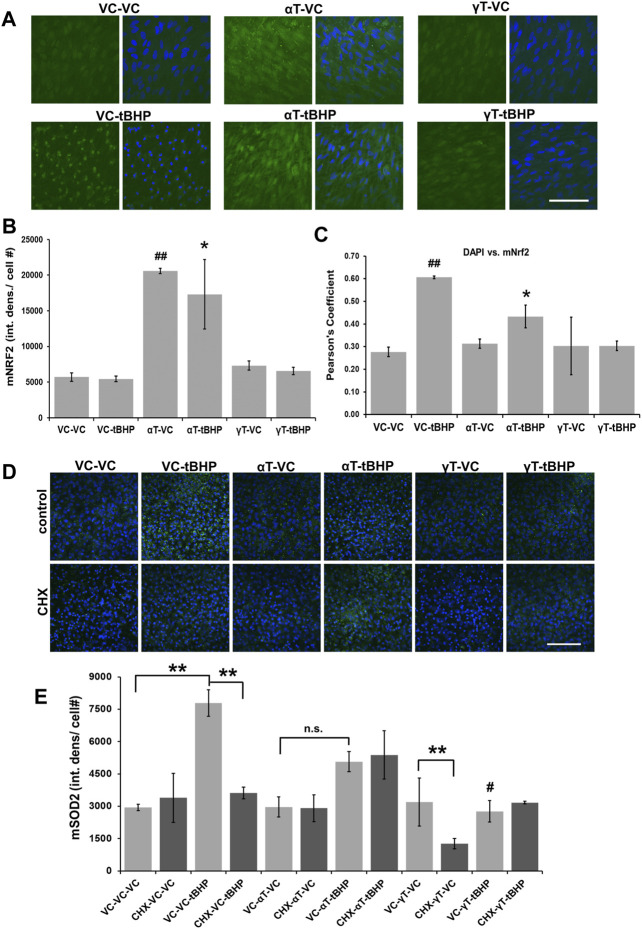
FIGURE 4.
Effect of αT, γT and Sublethal Oxidative Stress on Antioxidant Nrf2 and Sod2 Protein Expression. (A) The image panel shows Nrf2 IR (green) and the nucleus (blue) in the presence or absence of αT or γT with or without tBHP. Images are 63x magnification and the scale bar is 50 μm. (B) Quantitative graphical data calculated from images revealed that αT induced Nrf2 expression (Nrf2 IR) by 3.8-fold. Furthermore, oxidative stress by tBHP had no effect on αT-mediated increase in Nrf2 IR. (C) Colocalization analysis between Nrf2 IR and DAPI fluorescence reveals that tBHP, but not αT nor γT, leads to Nrf2-DAPI colocalization (r2 = 0.60). The presence of prevented this tBHP-mediated nuclear translocation of nrf2 and resulting Nrf2-DAPI colocalization. Microfluorimetric analyses are from an average of three images. *p = ≤0.05 versus VC-tBHP, *## p = ≤0.01 versus VC-VC as determined by one-way ANOVA analysis with Bonferroni post hoc test. (D) The image panel shows SOD2 IR (green) and the nucleus (blue) in the presence or absence of CHX as well as αT or γT with or without tBHP. Images are 40x magnification and the scale bar is 100 μm. (E) Quantitative data calculated from images revealed that exposure of cells to either αT or γT had no effect of SOD2 IR, while exposure to sublethal (100 μM) tBHP led to a 2.6-fold increase in SOD2 IR. Exposure of cells to αT does not significantly reduce tBHP-mediated induction of Sod2. Exposure of cells to γT led to a 64% reduction in tBHP-mediated induction of SOD2. Exposure of cells to CHX had no effect on Sod2 IR, but CHX with γT led to a 60% decrease in Sod2 IR. CHX reversed tBHP-mediated induction of Sod2. CHX had no effect on αT’s nor γT’s ability to reduce the induction of Sod2 mediated by tBHP. **p = ≤0.01; n.s.—not significant; # p = ≤0.01 versus VC-αT-tBHP as determined by one-way ANOVA analysis with Bonferroni post hoc test.

