FIGURE 1.
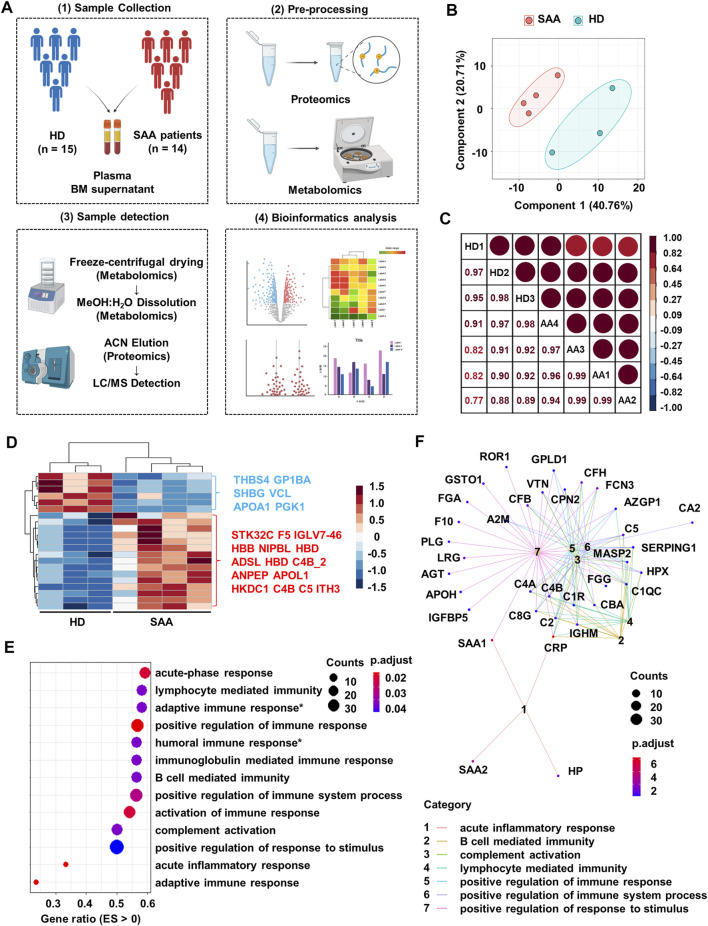
Proteomics profiling of plasma from SAA patients and healthy donors. (A) Schematic diagram of processes to obtain proteomics and metabolomics LC-MS of plasma and bone marrow supernatant from healthy donors (HD; n = 15) and SAA patients (SAA; n = 14). (B) PCA plot of the plasma protein samples from SAA (pink dots) patients and HD (green dots). (C) Pearson’s correlation analysis showing the coefficient of association of protein composition between each mixed sample from HD (n = 3) and SAA (n = 4). (D) Heatmap showing differentially expressed proteins (rows) in plasma from SAA group compared with HD group (Student’s t-test; fold change >2, Bonferroni adjusted p-value ≤0.05). (E) Dotplot showing enrichment pathways (ES > 0) of upregulated proteins in SAA patients compared with HD by gseGo analysis. ES, enrichment score; Humoral immune response*, humoral immune response mediated by circulating immunoglobulin; Adaptive immune response*, adaptive immune response based on somatic recombination of immune receptors built from immunoglobulin superfamily domains. (F) Cnetplot displaying protein network of seven pathways shown in panel E. SAA, severe aplastic anemia; LC-MS, liquid chromatography–mass spectrometry; PCA, principal component analysis; ES, enrichment score.

