Figure 1.

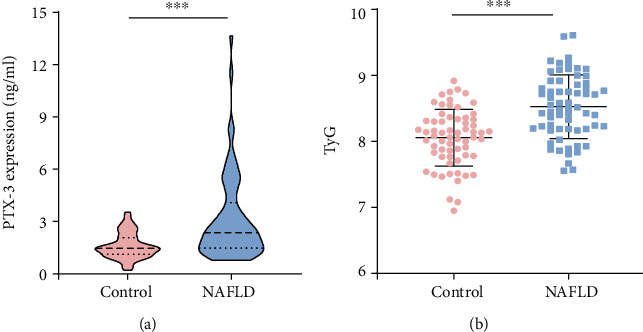
The expression of PTX-3 and the TyG index. (a) PTX-3 expression level detected by ELISA. (b) TyG index. ∗∗∗, compared with the healthy control group, P < 0.001.

The expression of PTX-3 and the TyG index. (a) PTX-3 expression level detected by ELISA. (b) TyG index. ∗∗∗, compared with the healthy control group, P < 0.001.