Figure 2.

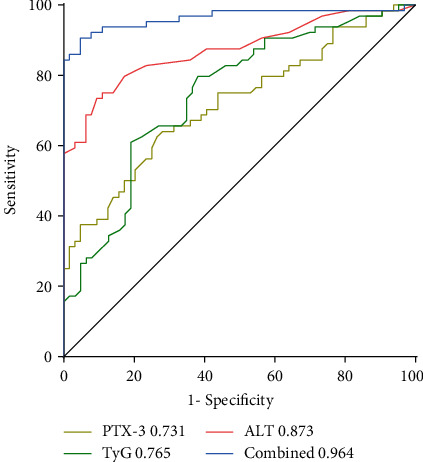
ROC curves of PTX-3, the TyG index, and ALT. The combination of PTX-3, the TyG index, and ALT had the largest AUC (0.964), followed by ALT (AUC: 0.873), the TyG index (AUC: 0.765), and PTX-3 (AUC: 0.731).

ROC curves of PTX-3, the TyG index, and ALT. The combination of PTX-3, the TyG index, and ALT had the largest AUC (0.964), followed by ALT (AUC: 0.873), the TyG index (AUC: 0.765), and PTX-3 (AUC: 0.731).