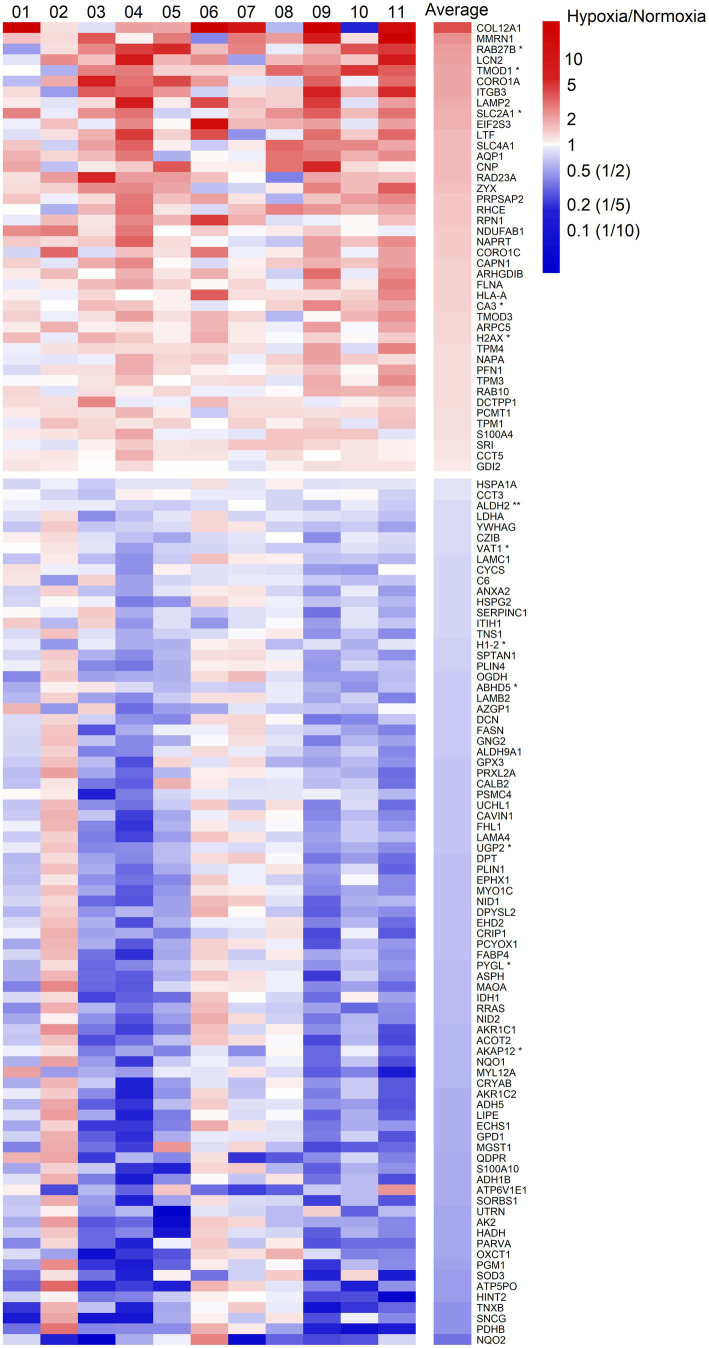
Figure 2.
Heatmap of fold changes of differentially expressed proteins at a significance level of p < 0.05 in abdominal subcutaneous adipose tissue following MIH compared to normoxia exposure in overweight and obese humans (n = 11). These proteins are labeled by gene symbols and are sorted by average fold changes. Each column represents one individual participant labeled by number, and the last column shows the average fold change. The color key is proportional to the log2 transformed fold change. *p < 0.01; **p < 0.001.

