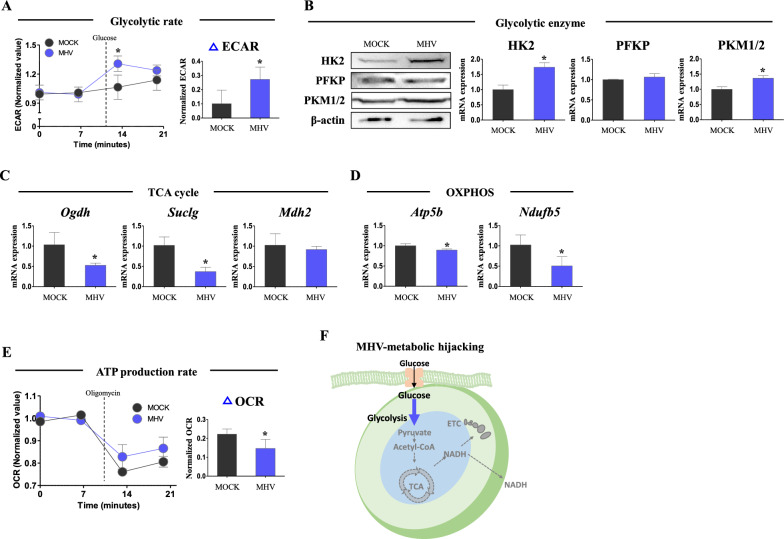
Fig. 1.
Host metabolic hijacking by MHV. Cells were infected by MHV (MOI 0.05) for 7 h. A Extracellular acidification rate measured by flux analyzer. Values were normalized by baseline value. Glucose (25 mM) was added for measurements. B Western blot analysis and quantification of glycolysis enzymes. β-actin was used for an internal control. C mRNA expression of TCA cycle enzymes. Rplp0 was used for an internal control. D mRNA expression of ETC enzymes. Rplp0 was used for an internal control. E Oxygen consumption rate measured by flux analyzer. Values were normalized by baseline value. Oligomycin (2 µM) was added for measurements. F Illustration of metabolic hijacking by MHV infection. Values represent means ± SD. *p < 0.05. Student’s t-test was performed. All experiments were repeated at least 3 times

