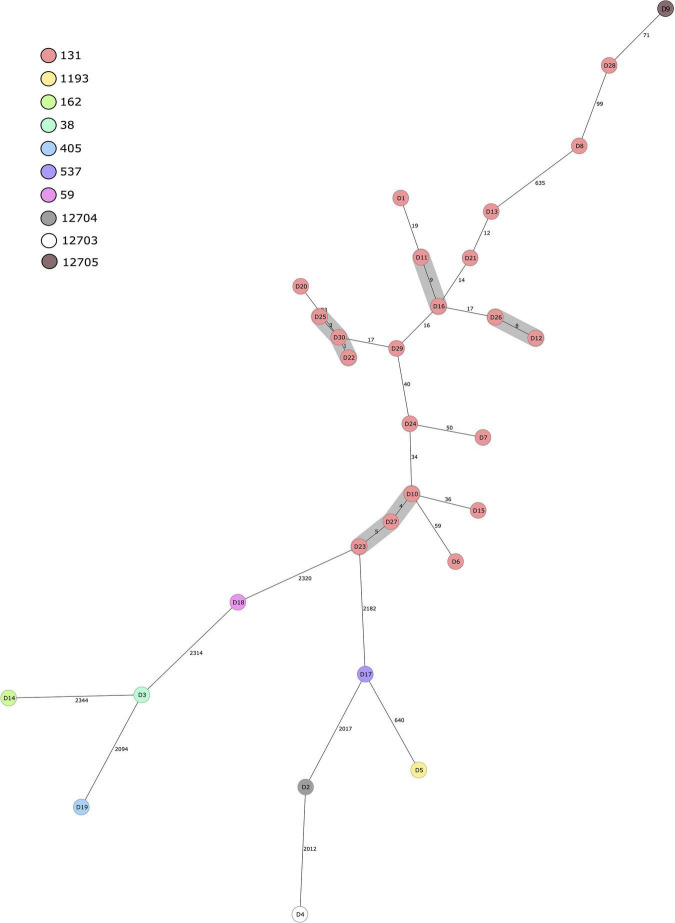
FIGURE 2.
Minimum spanning tree of 30 human ESBL-producing Escherichia coli isolates obtained from patients in Eastern Finland during 2018–2020. Tree was calculated in Ridom SeqSphere+ with 2513 core genome multilocus sequence typing (cgMLST) targets and 7 E. coli MLST Warwick targets (pairwise ignoring missing values, logarithmic scale). Nodes are colored according to sequence type. Number of allelic differences between isolates are indicated on the connecting lines. Clusters are defined as ≤10 allelic difference and shaded in gray.

