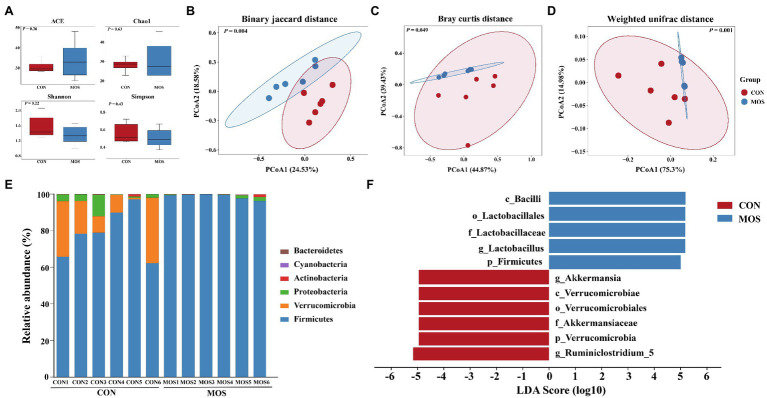
Figure 4.
Alpha diversity, beta diversity, and taxonomic analysis of the microbial communities in the ileal digesta samples of neonatal goats in the CON and MOS groups. (A) Alpha diversity index; Principal coordinate analysis (PCoA) score plots of the ileal microbiota based on the (B) Binary jaccard distance, (C) Baray curtis distance, and (D) weighted UniFrac distance; (E) The relative abundance of the microbial composition at the phylum level; (F) Linear discriminant analysis (LDA) effect size linear discriminant analysis (LEfSe) of the ileal microbiota. *p < 0.05, **p < 0.01.

