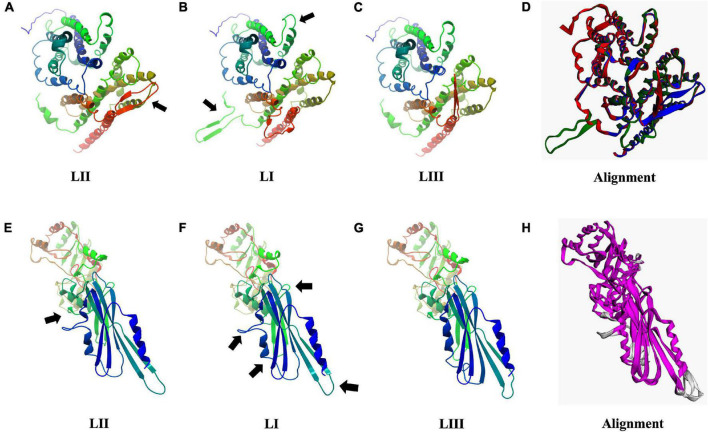
FIGURE 12.
Consequences of aa changing SNPs on 3D protein structure of Hpt (A–D) and PgdA (E–H). Black arrows highlight areas of most significant change. (D,H) 3D protein structure alignment. Key; for Hpt alignment (D) LI (green), LII (blue), and LIII (red). For PgdA alignment, (H) conserved chain regions are colored magenta, TM-score LI (0.9756), and LIII (0.9689) relative to LII.

