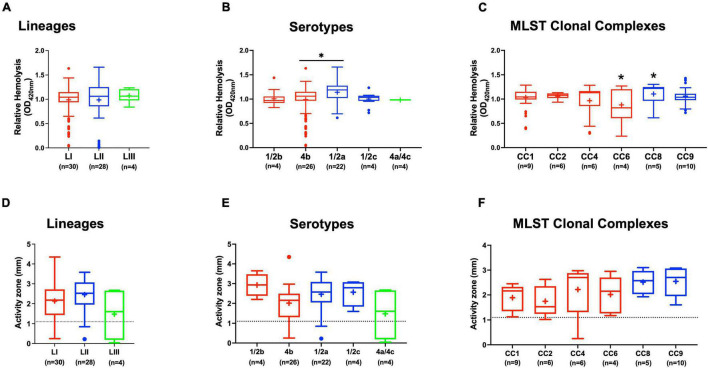
FIGURE 4.
Hemolysis and PI-PLC activity comparison. Presented are box plots showing (A–C) relative hemolysis capacity and (D–F) PI-PLC activity comparison among strains. *Significant difference between groups (P < 0.05), based on one-way analysis of variance and Tukey post hoc test pairwise comparison. Results are based on three independent biological repeats. Key; red: LI strains, blue: LII strains, green: LIII strains. Dotted line denotes a low PI-PLC activity cutoff value.

