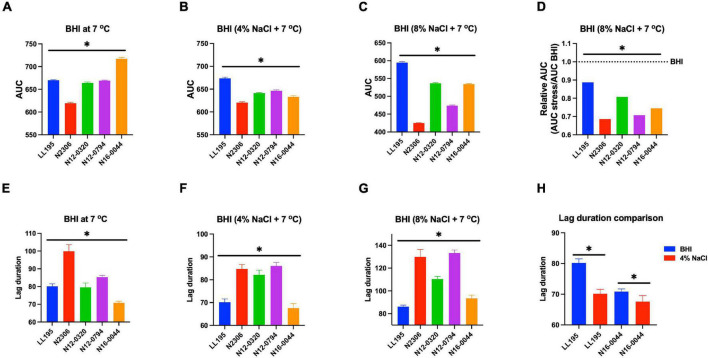
FIGURE 9.
Comparison of serotype 4b L. monocytogenes strains [N2306, N12-0320, and N12-0794 (CC4), LL195 (CC1), and N16-0044 (CC6)] growth profiles at low temperature with or without NaCl osmotic stress based on (A–D) area under curve and (E–H) lag phase duration extension. *Significant difference between strains and treatments (P < 0.05). Results are based on three independent biological repeats.

