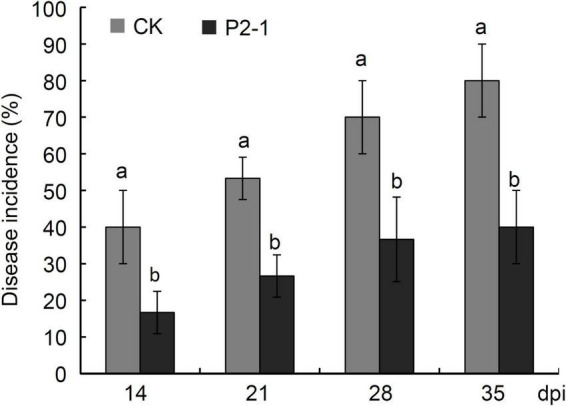
FIGURE 7.

Disease incidence of natural decay in apple fruits treated with B. velezensis strain P2-1 cell suspension after harvest. Each data represents the mean ± SD of three biological replicates at each time point. Different letters indicate significant differences between different treatments according to Student’s t-test (P < 0.05).
