Fig. 2.
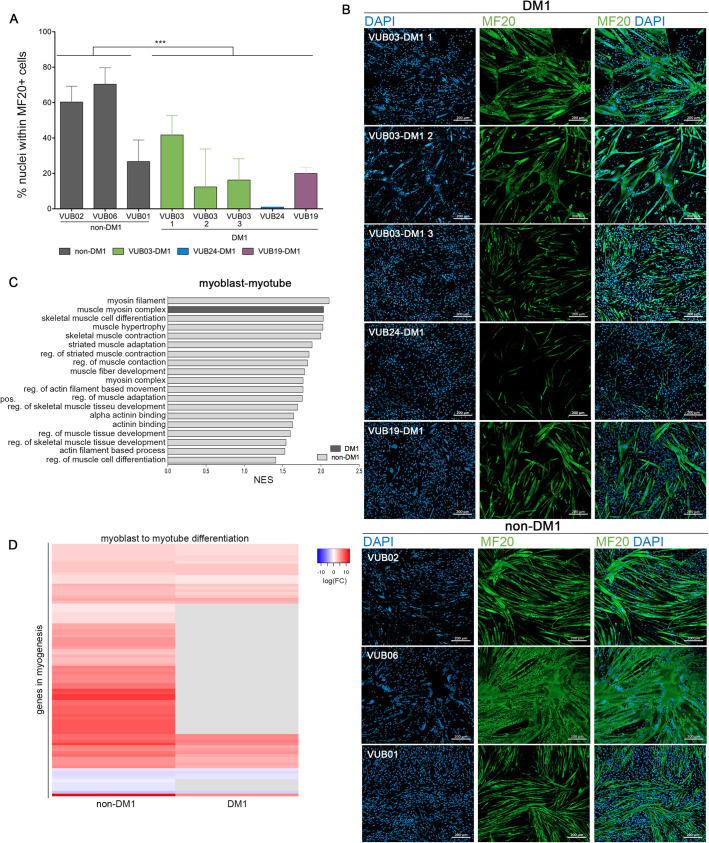
Myoblasts obtained from DM1-hESC have a decreased ability to progress to the myotube stage. (A) Percentage of nuclei within a myosin heavy chain (MF20) positive myotube (n=3). *** P=0.0003, t-test. (B) Immunostaining for myosin heavy chain (MF20) for three control non-DM1 cell lines and three DM1 cell lines after myotube differentiation. (C) GO terms for muscle-related gene sets that are significantly enriched in the differential gene expression between the myoblast and myotube stage, using Gene Set Enrichment Analysis. The plot only shows those GO terms that are exclusively enriched for DM1 and non-DM1 samples. The full list of gene sets, including 20 common pathways, can be found in Table S3. (D) The heatmap shows the differential gene expression the hallmark gene set ‘myogenesis’ of the molecular signatures database, for DM1 and non-DM1 myoblast to myotube differentiation. Genes in grey have an FDR>0.05. The grey bars indicate genes for which the expression level did not change between two developmental stages. The full list of included genes can be found in the Table S5. NES, normalized enrichment score; MB, myoblasts; MT, myotubes; FC, fold change.

