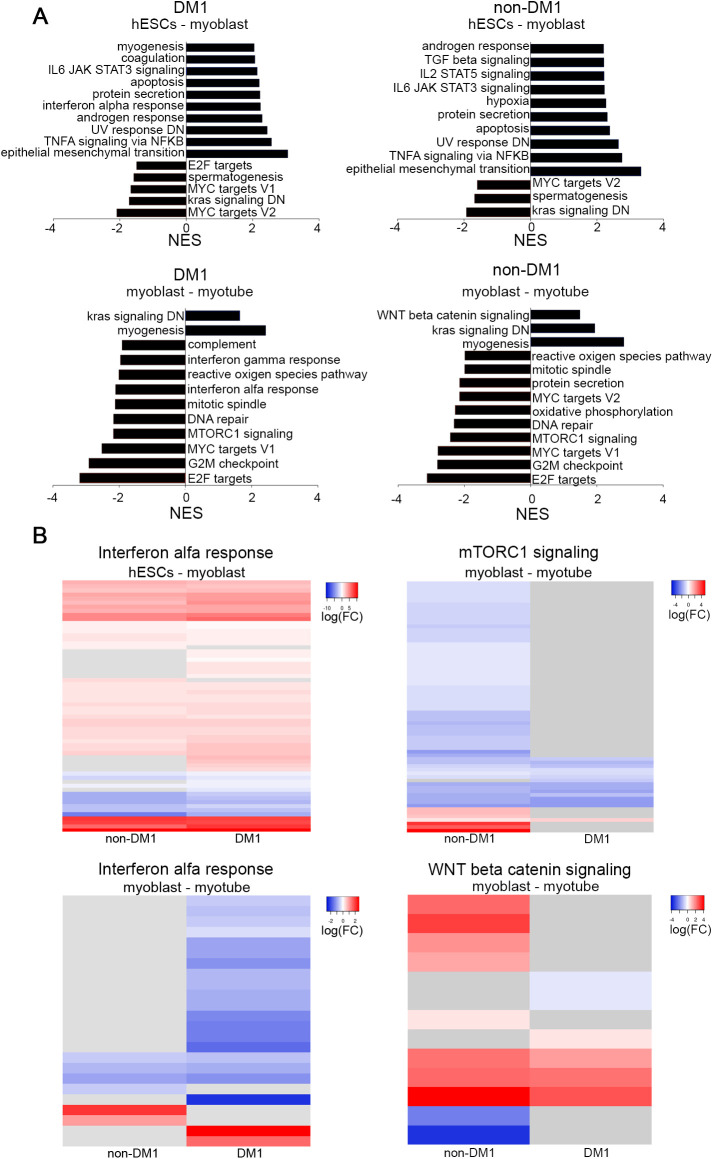
Fig. 3.
Pathway analysis in DM1 and non-DM1 samples during myogenic differentiation shows differences in inflammatory response and mTORC1 signalling. (A) Top ten up- and downregulated pathways. The top panel presents myoblasts compared to hESC, the lower panel represents myotubes compared to myoblasts. (B) Heatmaps representing the log fold change of genes belonging to the interferon alpha response, mTORC1 and canonical WNT signalling. The grey bars indicate genes for which the expression level did not change between two developmental stages. The full list of genes, their log2FC and FDR are listed in Table S6. Grey lines indicate genes with FDR>0.05. NES, normalized enrichment score; FC, fold change.

