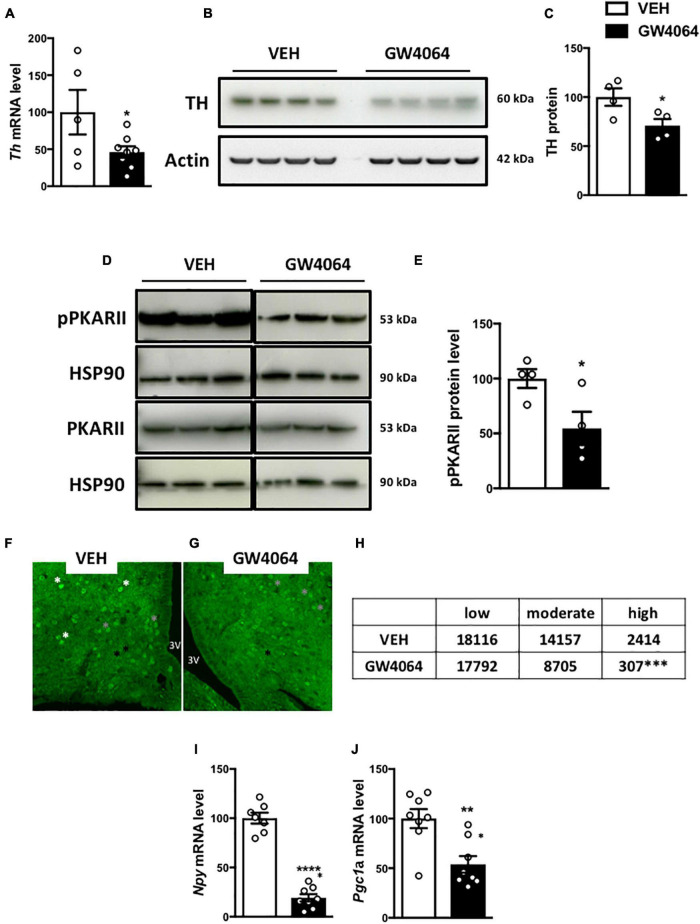
FIGURE 7.
Intracerebral treatment with GW4064 alters PKA-CREB signaling and TH expression in the hypothalamus. (A) Th mRNA expression in hypothalamus by q-PCR. The values are normalized to 18 s. (B) TH protein expression in hypothalamus. (C) The bar graphs are the quantification of TH western blots in panel (B). (D) pPKARII and PKARII protein expression in hypothalamus. Results are represented in the form of boxes for illustration purposes. For an experiment, all samples are processed in the same western blot. If different gels were used if the number of wells was insufficient, we took the precaution of introducing one or more common samples within each gel to standardize the results. (E) The bar graphs are the quantification of pPKARII western blots in panel (D). (F,G) Representative images of pCREB immunostaining in ARH of vehicle group (F) and GW4064 group (G). (H) Quantification of pCREB-positive cells with a low (black asterisk), moderate (gray asterisk), and high staining (white asterisk). (I,J) Npy and Pgc1a mRNA expression in ARH. The values are normalized to cyclophilin. Data are mean ± SEM. *P < 0.05, **P < 0.01, ***P < 0.001, ****P < 0.0001, Unpaired Student’s t test. For pCREB quantification, X2 test was performed. Vehicle group is indicated as open bars, GW4064 group as black bars.

