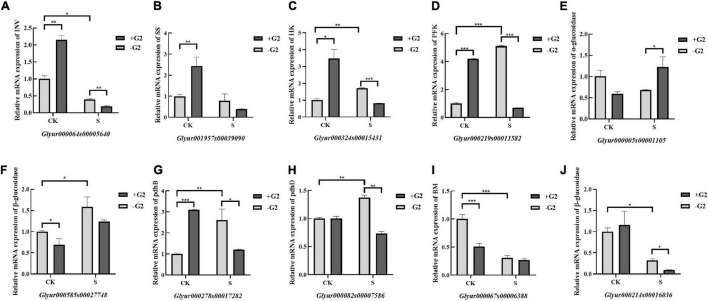
FIGURE 10.
Expression of carbohydrate metabolism-related genes (qRT-PCR) in G. uralensis in four treatments (CK, CK + G2, S, and S + G2). CK, control group; S, salt stress group; CK + G2, control combined with the G2 group; S + G2, salt stress combined with the G2 group (mean ± SD; *p < 0.05; **p < 0.01; ***p < 0.001). (A) INV: beta-fructofuranosidase. (B) SS: sucrose synthase. (C) HK: hexokinase. (D) PFK: 6-phosphofructokinase 1. (E) α-glucosidase: alpha-glucosidase. (F,J) β-glucosidase: beta-glucosidase. (G) pdhB: pyruvate dehydrogenase E1 component beta subunit. (H) pdhD: dihydrolipoamide dehydrogenase (I) BM: beta-amylase.

