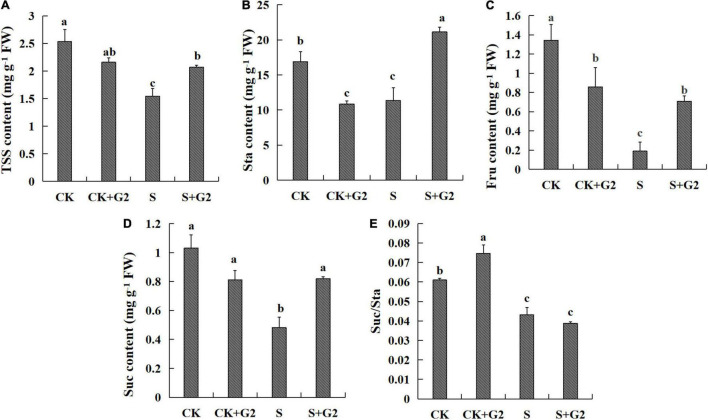
FIGURE 2.
Effects of B. cereus G2 on carbohydrates contents in G. uralensis seedlings under control and salt stress conditions. CK, control group; S, salt stress group; CK + G2, control combined with the G2 group; S + G2, salt stress combined with the G2 group. The different letters within the different treatments in the same parameter indicate the significant difference at the 0.05 level. Values are means ± SE (n = 3). (A) TSS: total soluble sugar. (B) Sta: starch. (C) Fru: fructose. (D) Suc: sucrose. (E) Suc/Sta: sucrose/starch.

