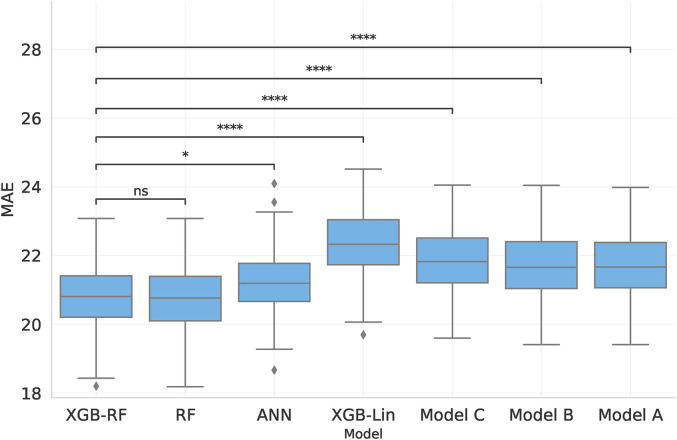
Figure 1.
Comparison of the MAE of predicting the post-operative WRS on all datasets combined using four novel models and three baseline models, where Models A and B are linear and Model C is a Random Forest. The first four boxes use all features in our dataset, while the remaining boxes are the baseline models. Statistical significance of the drop in performance compared to XGB-RF is shown by lines above the bars, where symbols correspond to the following p-values: ns : p > 0.05, * : p ≤ 0.05, **: p ≤ 0.01, *** : p ≤ 0.001, ****: p ≤ 0.0001.

