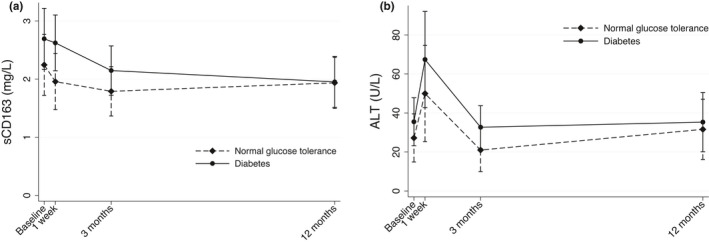
FIGURE 1.

Concentrations of sCD163 and ALT in patients with preoperative diabetes and normal glucose tolerance at baseline and after RYGB. Means with 95% confidence intervals. (a) sCD163, time x group p = 0.08; (b) ALT, time x group p = 0.86. Analyzed using ANOVA in a linear mixed‐effects model using time from surgery and group as fixed effects and individual subjects as random effect
