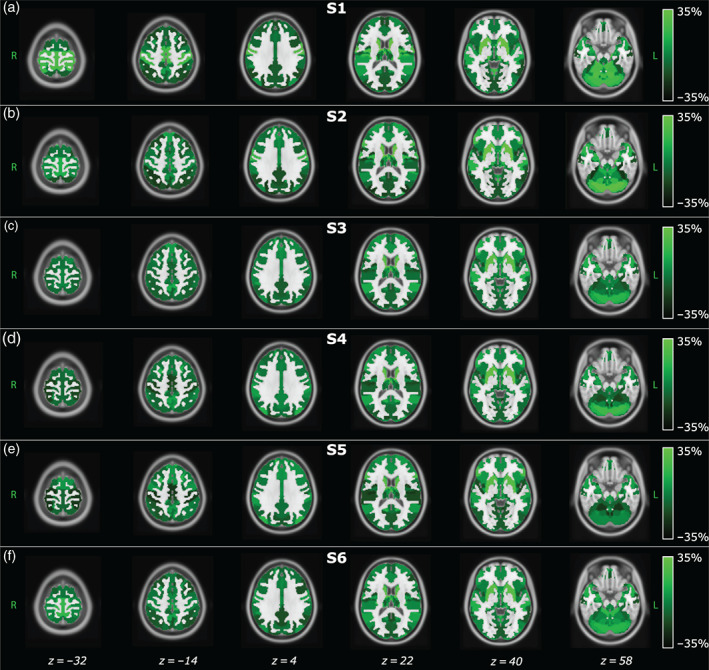
FIGURE 3.

Spatial distribution of the distance between each IC's CV and the average CV among ICs within the same state (ΔCVs) obtained for each brain state. Since the model was inferred at the population level, that is, concatenating the IC time courses of young and old participants, these maps represent group‐level estimates. Positive values represent an increment in CV with respect to the mean value of the CVs obtained in each state. Therefore, bright colors are associated with more uncertain ICs. The spatial distributions are overlaid to the MNI atlas, shown in gray scale. The labels S1, S2, and so forth refer to State 1, State 2, and so forth
