FIGURE 4.

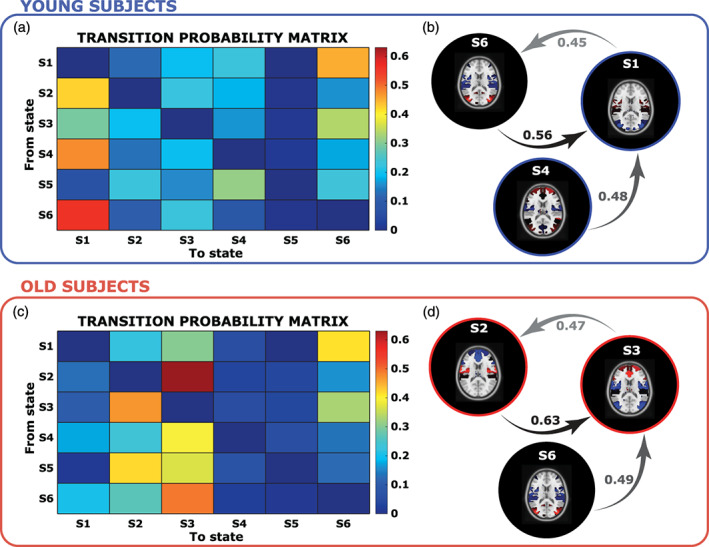
In Panels (a) and (c), the transition probabilities from one state (y‐axis) to another (x‐axis), for the young and O, are reported. Finally, Panels (b) and (d) show the three top most likely transition probabilities and links

In Panels (a) and (c), the transition probabilities from one state (y‐axis) to another (x‐axis), for the young and O, are reported. Finally, Panels (b) and (d) show the three top most likely transition probabilities and links