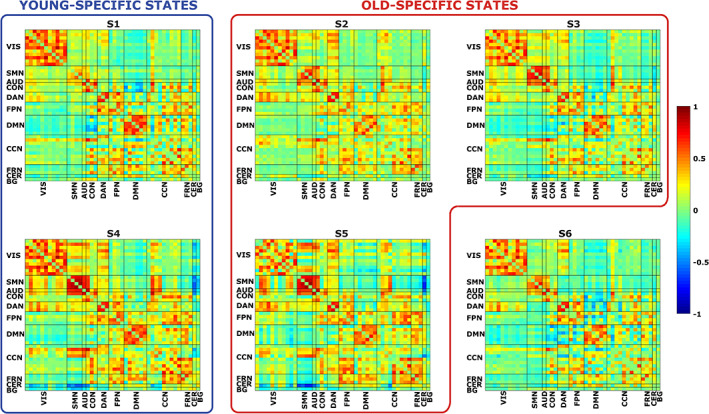
FIGURE 6.

Each panel represents the FC matrix associated to a particular brain state (S1, S2, etc.). In both the x‐ and y‐axis, we have the 46 ICs, divided in the 11 functional domains. Warm colors represent high positive correlations values between ICs, whereas cool colors represent high anti‐correlations values. We grouped together states mostly populated by young subjects (blue box) and by old subjects (red box)
